Fig. 5
Download original image
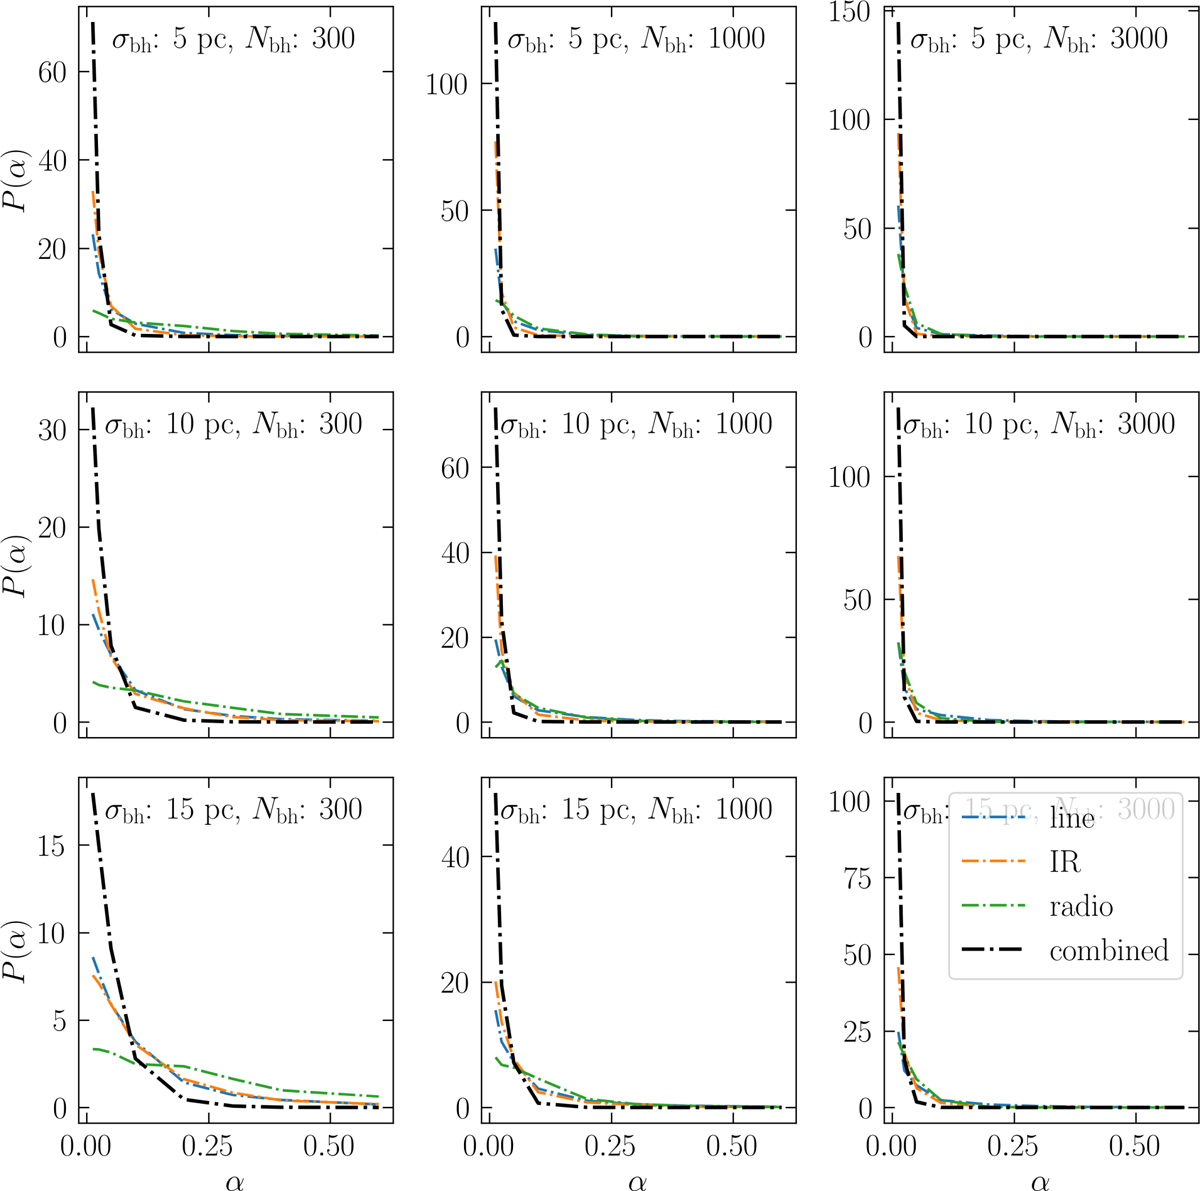
Probability distributions for the fraction of mass in microlenses, α. For each panel, the choice of Nbh and σbh was fixed; the x axis parameterizes the value of α. The colored lines correspond to the probability distribution if only one type of flux (lines, IR, or radio emissions) is considered. The black line corresponds to the combined probability distribution using all the available fluxes.
Current usage metrics show cumulative count of Article Views (full-text article views including HTML views, PDF and ePub downloads, according to the available data) and Abstracts Views on Vision4Press platform.
Data correspond to usage on the plateform after 2015. The current usage metrics is available 48-96 hours after online publication and is updated daily on week days.
Initial download of the metrics may take a while.