Fig. 4
Download original image
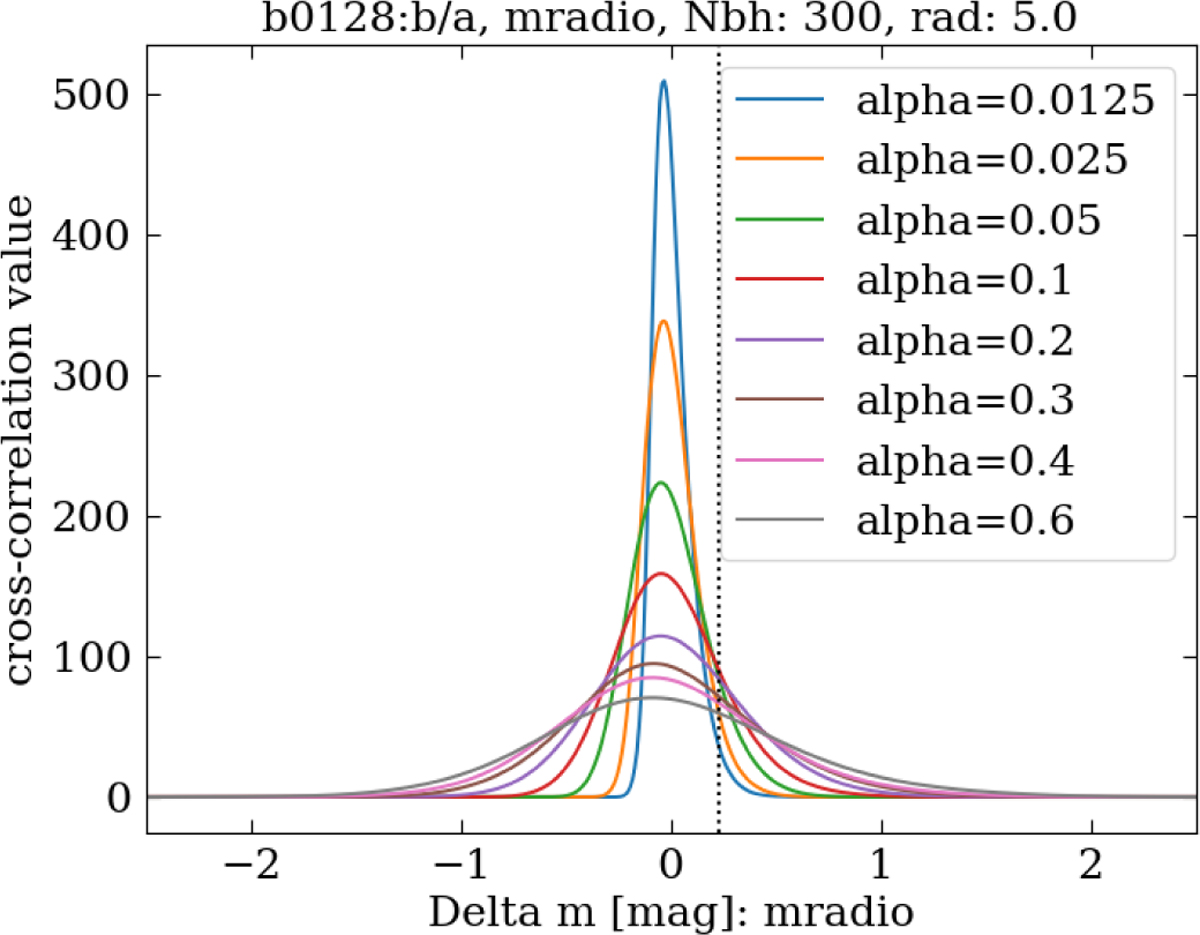
Example cross-correlation of magnification histograms. The colored lines describe the probability of observing a magnification difference of Δm between images a and b of the B 0128+437 lens system for the model with Nbh = 300 and = 5 pc. The dashed line represents the actually observed difference. We note that the smoothing of Δm = 0.24 to account for observational or model errors has already been applied to these histograms.
Current usage metrics show cumulative count of Article Views (full-text article views including HTML views, PDF and ePub downloads, according to the available data) and Abstracts Views on Vision4Press platform.
Data correspond to usage on the plateform after 2015. The current usage metrics is available 48-96 hours after online publication and is updated daily on week days.
Initial download of the metrics may take a while.