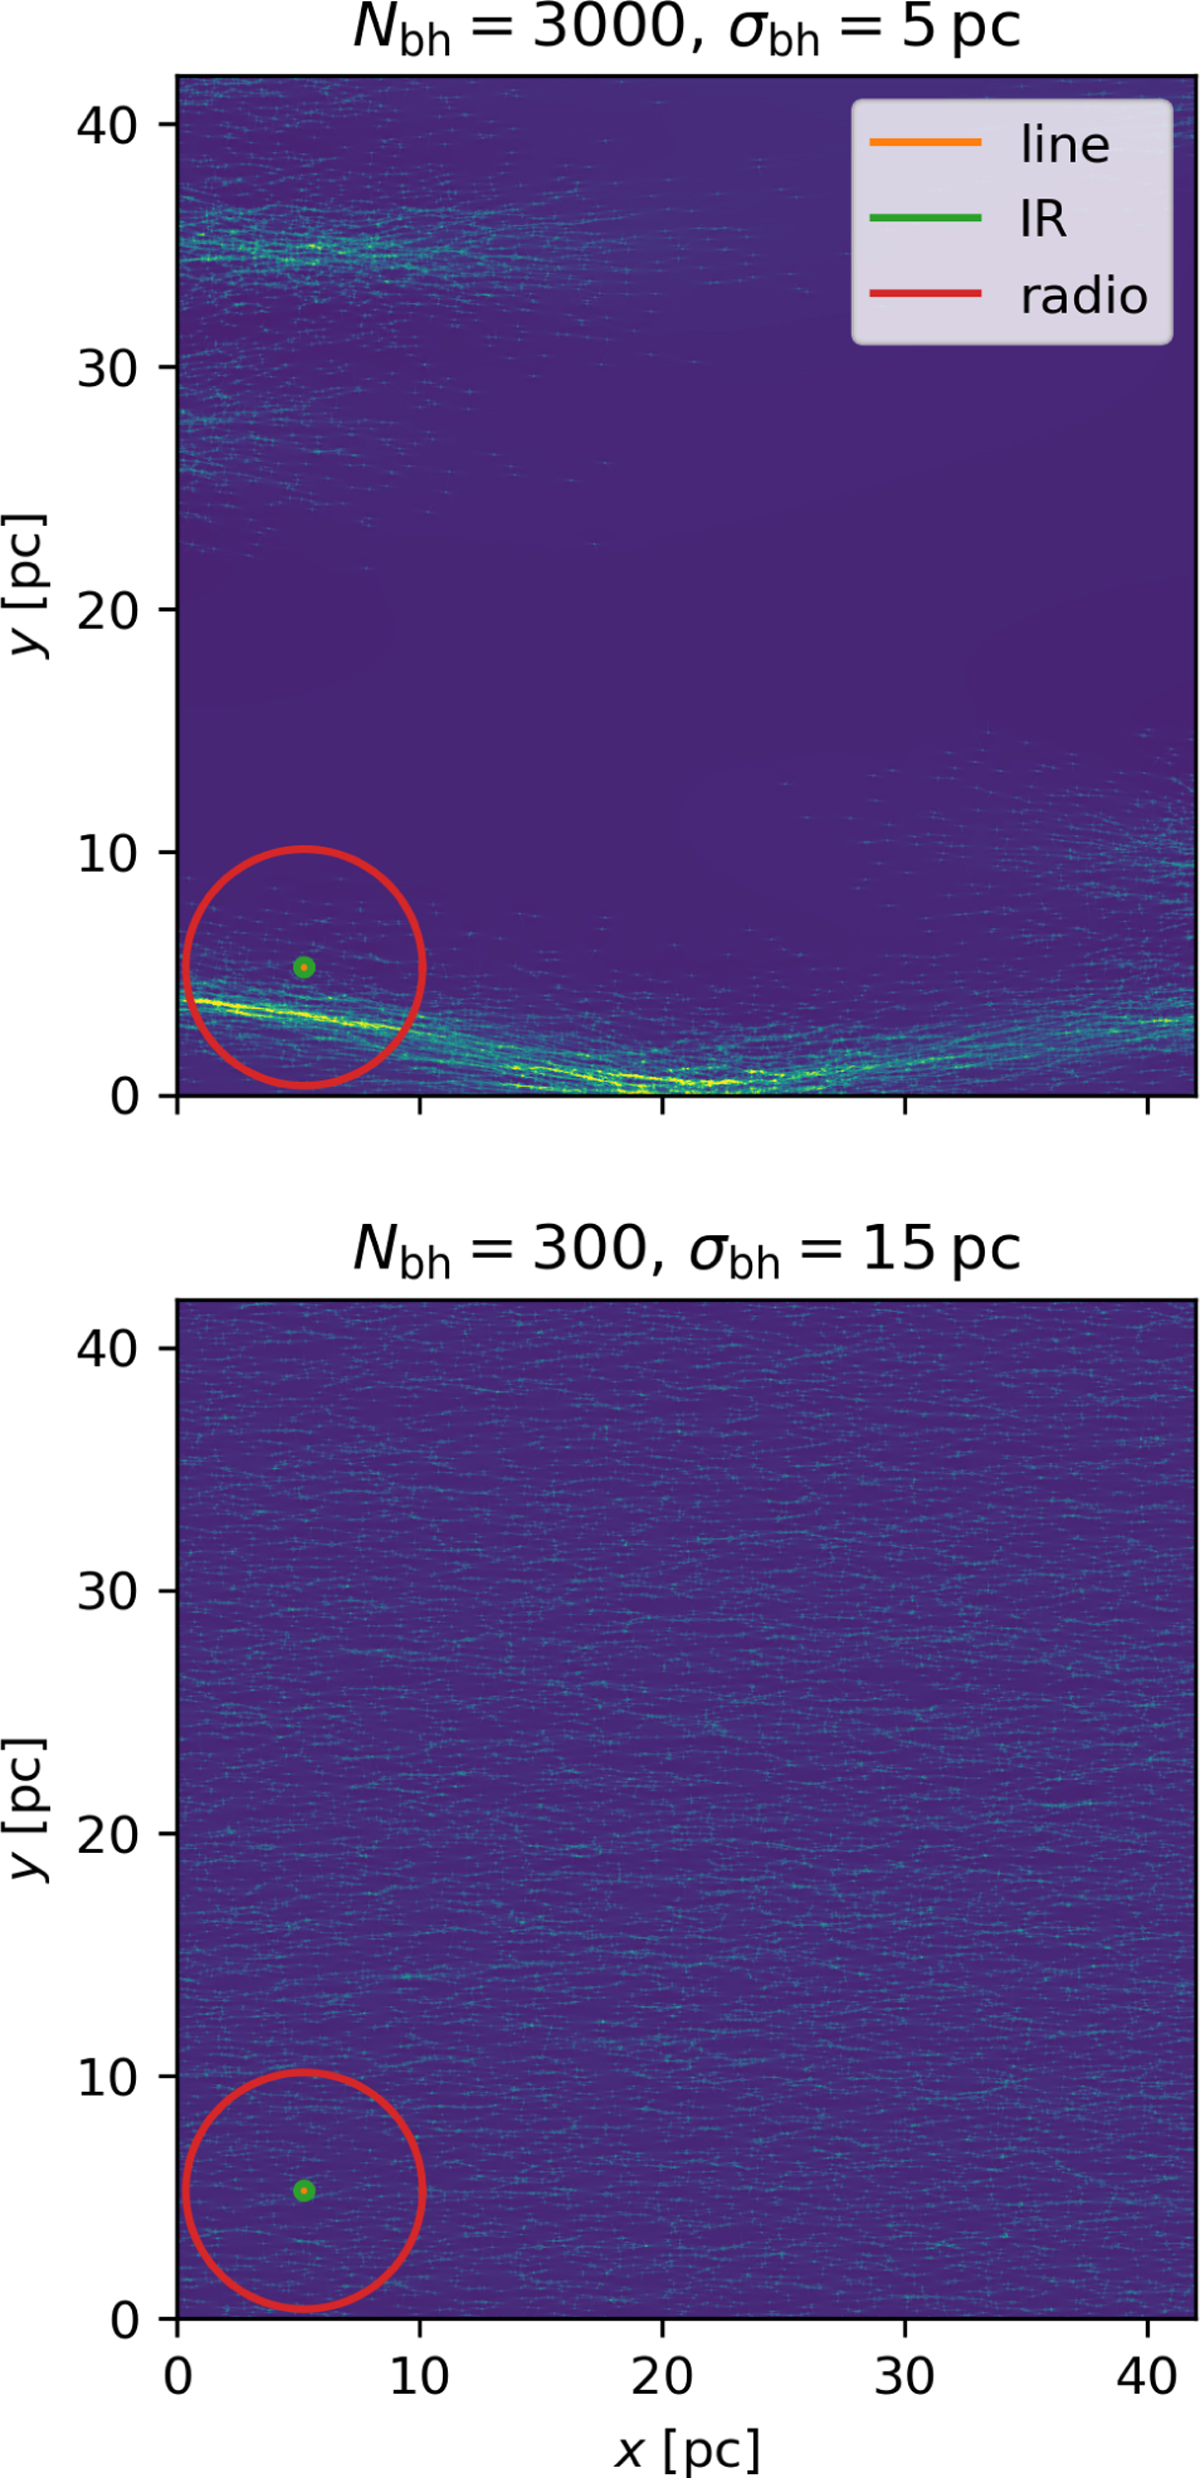
Fig. 2
Download original image
Two example magnification maps for image C of B 1555. In both cases, the fraction of microlenses is α = 0.2. The source sizes for line, IR, and radio emission are indicated as orange, green, and red circles, respectively. The top panel shows that when many BHs are contained in a very dense cluster, the magnification map is dominated by the features caused by the clusters themselves (notice the flocculent giant caustic). The magnification distribution in the lower panel, on the contrary, appears closer to that of a uniform lens population.
Current usage metrics show cumulative count of Article Views (full-text article views including HTML views, PDF and ePub downloads, according to the available data) and Abstracts Views on Vision4Press platform.
Data correspond to usage on the plateform after 2015. The current usage metrics is available 48-96 hours after online publication and is updated daily on week days.
Initial download of the metrics may take a while.