Fig. 9.
Download original image
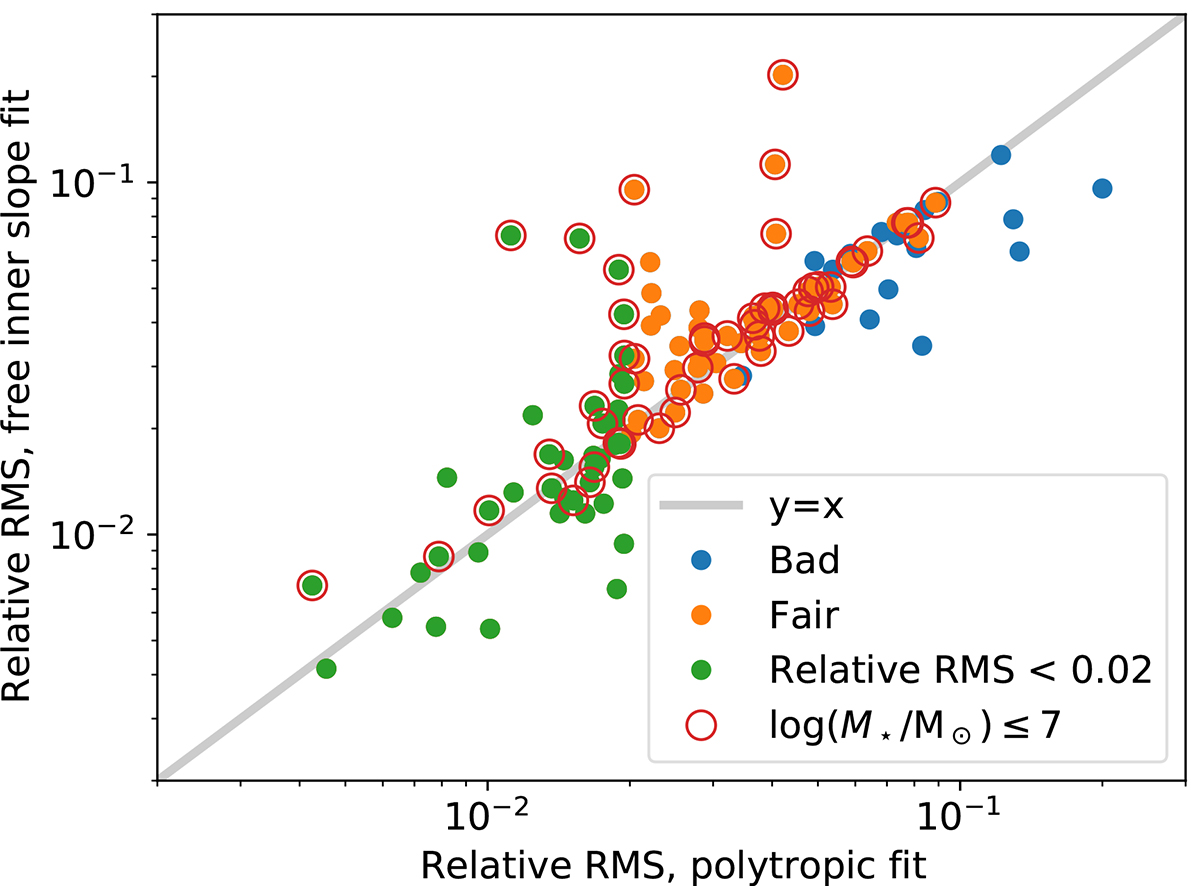
Scatter plot of the Relative RMS resulting from variable inner slope fits and from polytropic fits. Different colors designate different qualities of the polytropic fits (see the inset). The points corresponding to low-mass galaxies are encircled in red. The absolute number of good polytropic fits is larger, as is the relative fraction of good over bad fits.
Current usage metrics show cumulative count of Article Views (full-text article views including HTML views, PDF and ePub downloads, according to the available data) and Abstracts Views on Vision4Press platform.
Data correspond to usage on the plateform after 2015. The current usage metrics is available 48-96 hours after online publication and is updated daily on week days.
Initial download of the metrics may take a while.