Fig. 8.
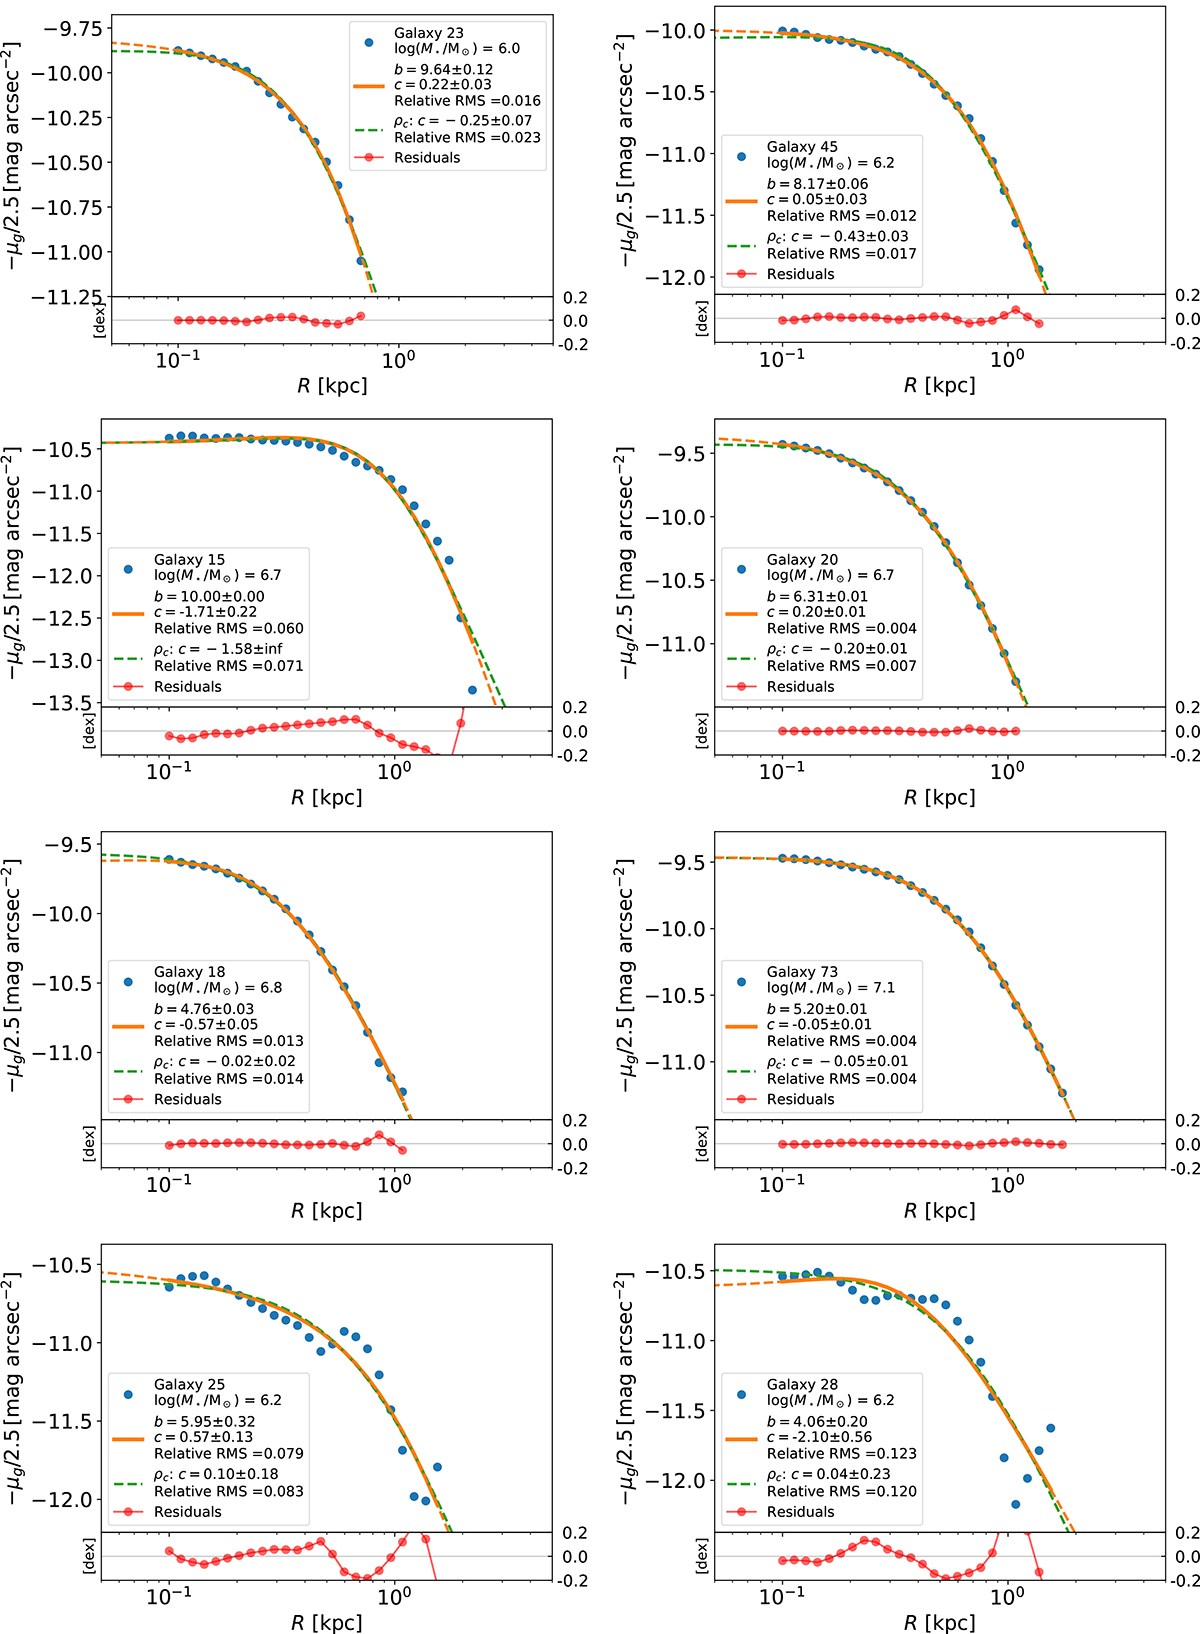
Download original image
Fits similar to those shown in Fig. 2 but allowing the inner slope of the stellar mass profile to vary (dashed green lines) and the inner and outer slopes to vary independently (orange lines). The density used for the fitting was assumed to be ρabc in Eq. (15) with different bonds between a, b, and c for the green and orange lines. See the main text and the caption of Fig. 2 for further details.
Current usage metrics show cumulative count of Article Views (full-text article views including HTML views, PDF and ePub downloads, according to the available data) and Abstracts Views on Vision4Press platform.
Data correspond to usage on the plateform after 2015. The current usage metrics is available 48-96 hours after online publication and is updated daily on week days.
Initial download of the metrics may take a while.