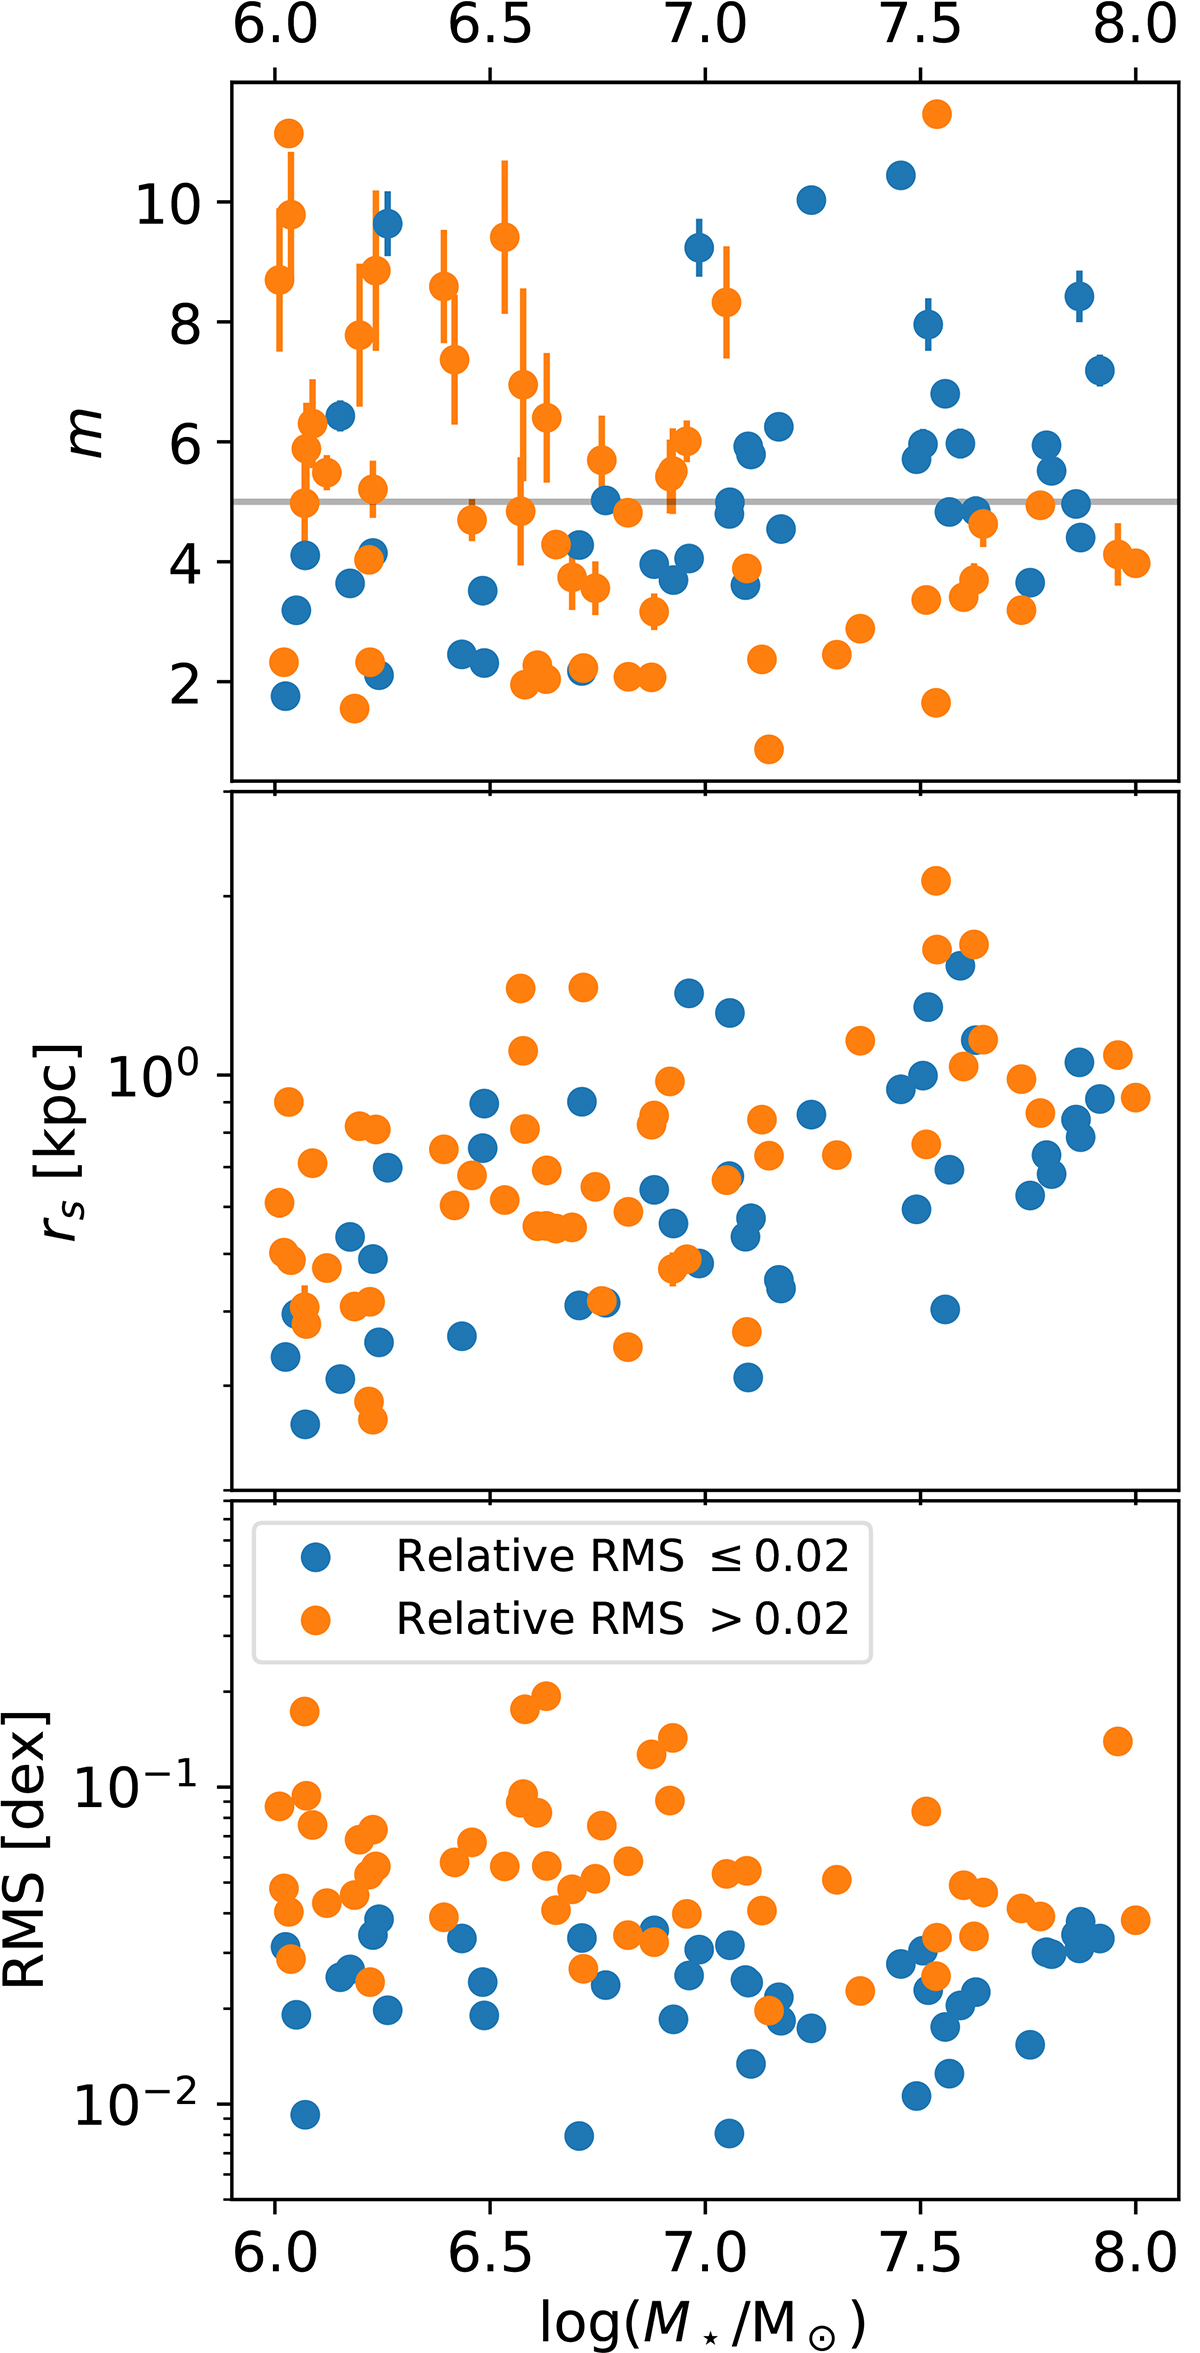
Fig. 7.
Download original image
Quantitative summary with the results of the polytropic fit to the profiles shown in Fig. 1. Medium- (Relative RMS > 0.02) and high-quality (≤0.02) fits are represented with different colors, as indicated in the bottom panel. Top panel: Scatter plot of the polytropic index, m, as a function of the stellar mass of the galaxy. Middle panel: Variation of the core radius with stellar mass. More massive galaxies tend to have larger cores. Bottom panel: Scatter plot with the variation of the absolute RMS with stellar mass. Good fits (blue dots) have absolute RMS ≲0.03 dex.
Current usage metrics show cumulative count of Article Views (full-text article views including HTML views, PDF and ePub downloads, according to the available data) and Abstracts Views on Vision4Press platform.
Data correspond to usage on the plateform after 2015. The current usage metrics is available 48-96 hours after online publication and is updated daily on week days.
Initial download of the metrics may take a while.