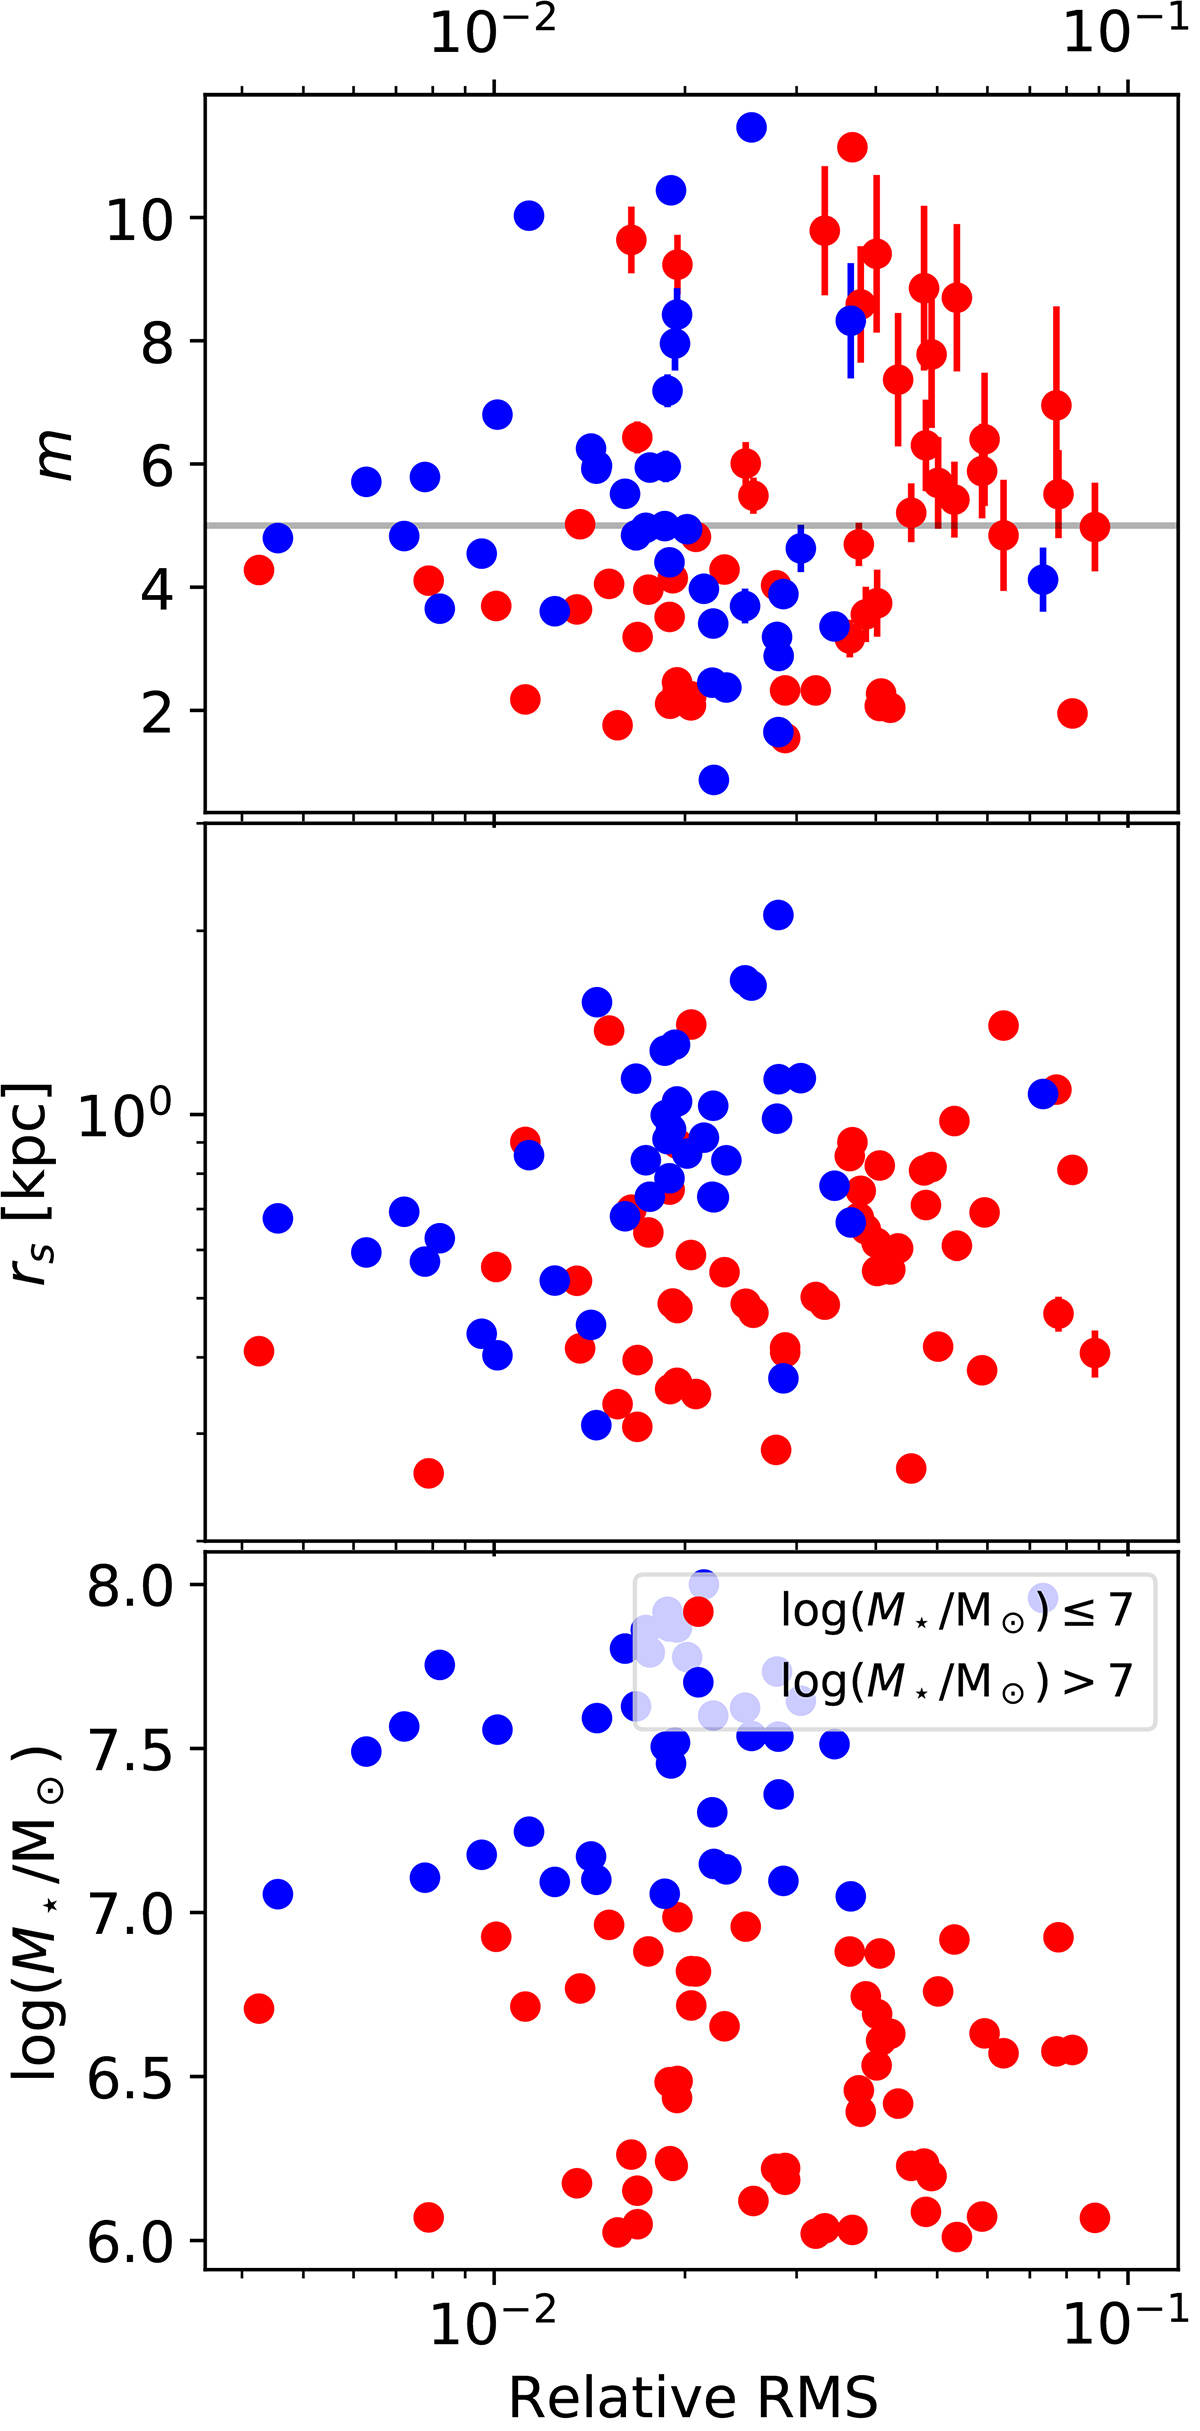
Fig. 6.
Download original image
Quantitative summary with the results of the polytropic fit to the profiles shown in Fig. 1. Low (≤107 M⊙) and high (> 107 M⊙) stellar mass galaxies are represented with a different color, as indicated in the bottom panel. Top panel: Dependence of the inferred polytropic index, m, on the quality of the fits, as parameterized by the Relative RMS. There seems to be a trend for the best quality fits to have m ∼ 5 (marked with the horizontal solid gray line). Middle panel: Scatter plot with the size of the core versus the goodness of the fit. Bottom panel: Scatter plot with the stellar mass versus the goodness of the fit. More massive galaxies lead to slightly better fits.
Current usage metrics show cumulative count of Article Views (full-text article views including HTML views, PDF and ePub downloads, according to the available data) and Abstracts Views on Vision4Press platform.
Data correspond to usage on the plateform after 2015. The current usage metrics is available 48-96 hours after online publication and is updated daily on week days.
Initial download of the metrics may take a while.