Fig. 5.
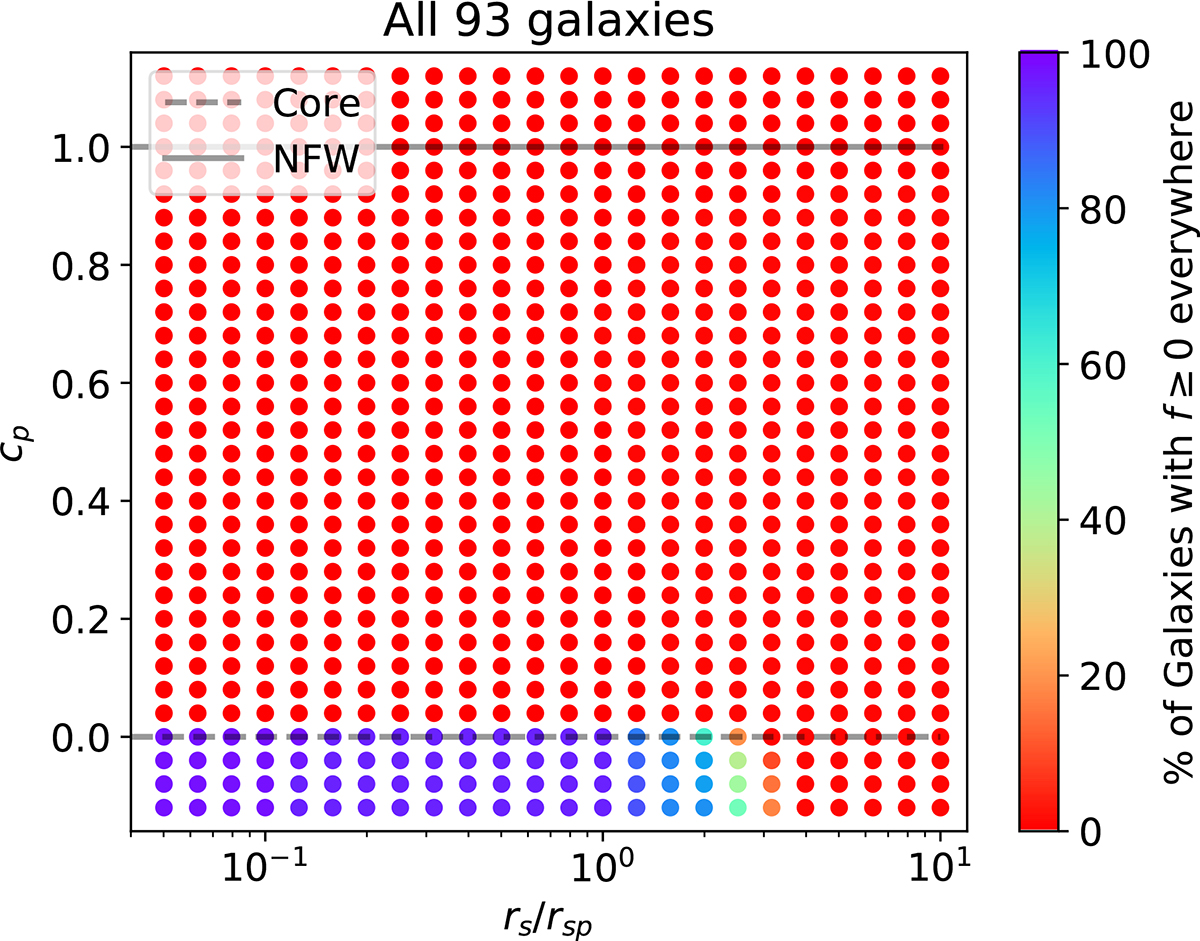
Download original image
Constraints on the underlying potential imposed by the set of polytropic fits like to those shown in Fig. 2. Every potential is characterized by cp and rsp, and the color code shows the frequency of having f ≥ 0 considering all good and fair fits (93 galaxies). The whole region of cp > 0 is discarded, whereas cp ≤ 0 is permitted provided rsp ≳ rs/2. The diagram does not change much when only good fits are considered (Relative RMS < 0.02) or when only low-mass galaxies are selected (M⋆ ≤ 107 M⊙). The parameter rs gives the spatial scale of the stellar light distribution. Horizontal lines defining NFW potentials (cp = 1; solid gray line) and cored potentials (cp = 0; dashed gray line) are included.
Current usage metrics show cumulative count of Article Views (full-text article views including HTML views, PDF and ePub downloads, according to the available data) and Abstracts Views on Vision4Press platform.
Data correspond to usage on the plateform after 2015. The current usage metrics is available 48-96 hours after online publication and is updated daily on week days.
Initial download of the metrics may take a while.