Fig. 4.
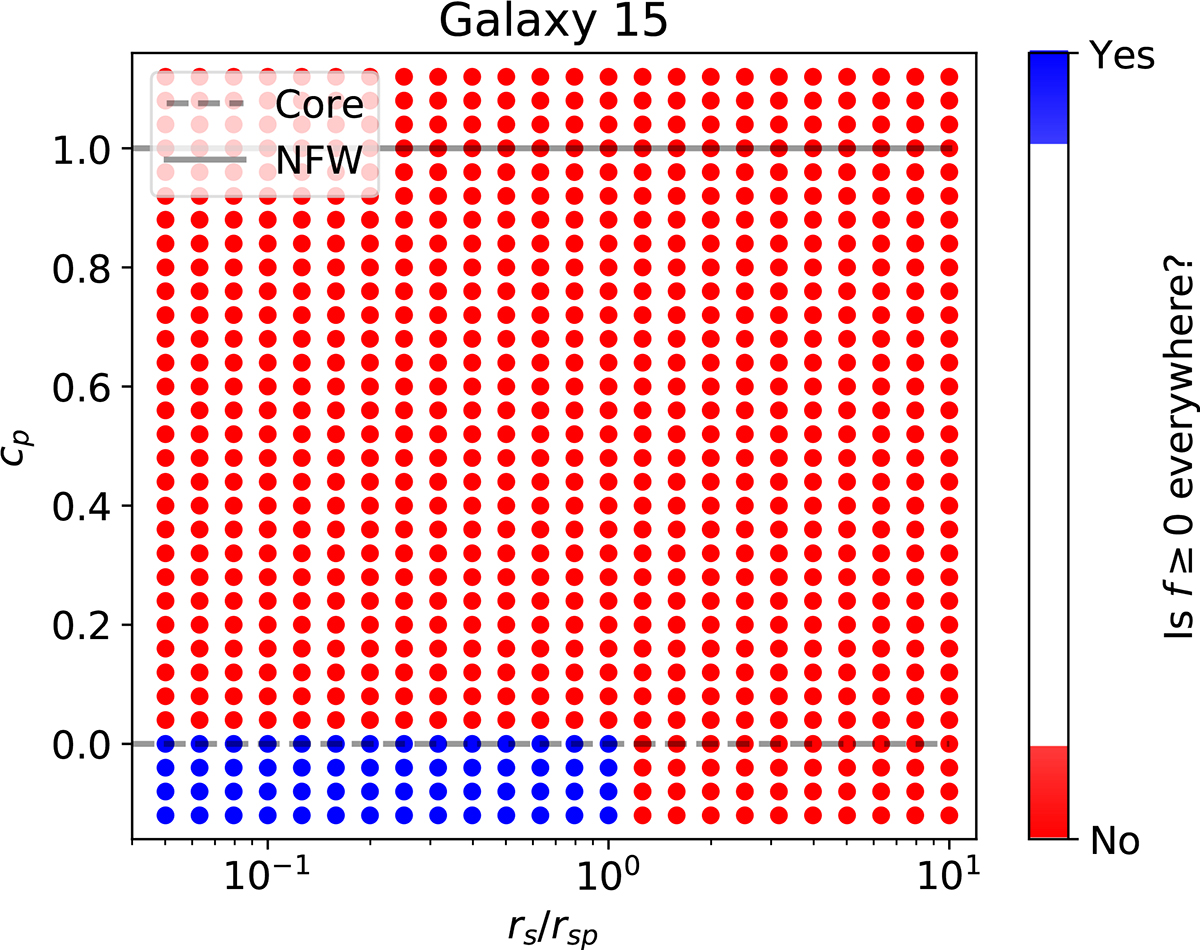
Download original image
Constraints on the underlying potential inferred from the polytropic fit of a representative galaxy. The corresponding fit is shown in Fig. 2 (first column, second row). Each potential is characterized by two parameters, as shown in Eq. (18): the inner slope, cp, and the global spatial scale, rsp. Red dots correspond to f < 0 and so mark unphysical potentials, whereas blue dots correspond to f ≥ 0 and so trace potentials consistent with the density profile. The parameter rs gives the spatial scale of the stellar light distribution. The horizontal lines define NFW potentials (cp = 1; solid gray line) and cored potentials (cp = 0; dashed gray line).
Current usage metrics show cumulative count of Article Views (full-text article views including HTML views, PDF and ePub downloads, according to the available data) and Abstracts Views on Vision4Press platform.
Data correspond to usage on the plateform after 2015. The current usage metrics is available 48-96 hours after online publication and is updated daily on week days.
Initial download of the metrics may take a while.