Fig. 2.
Download original image
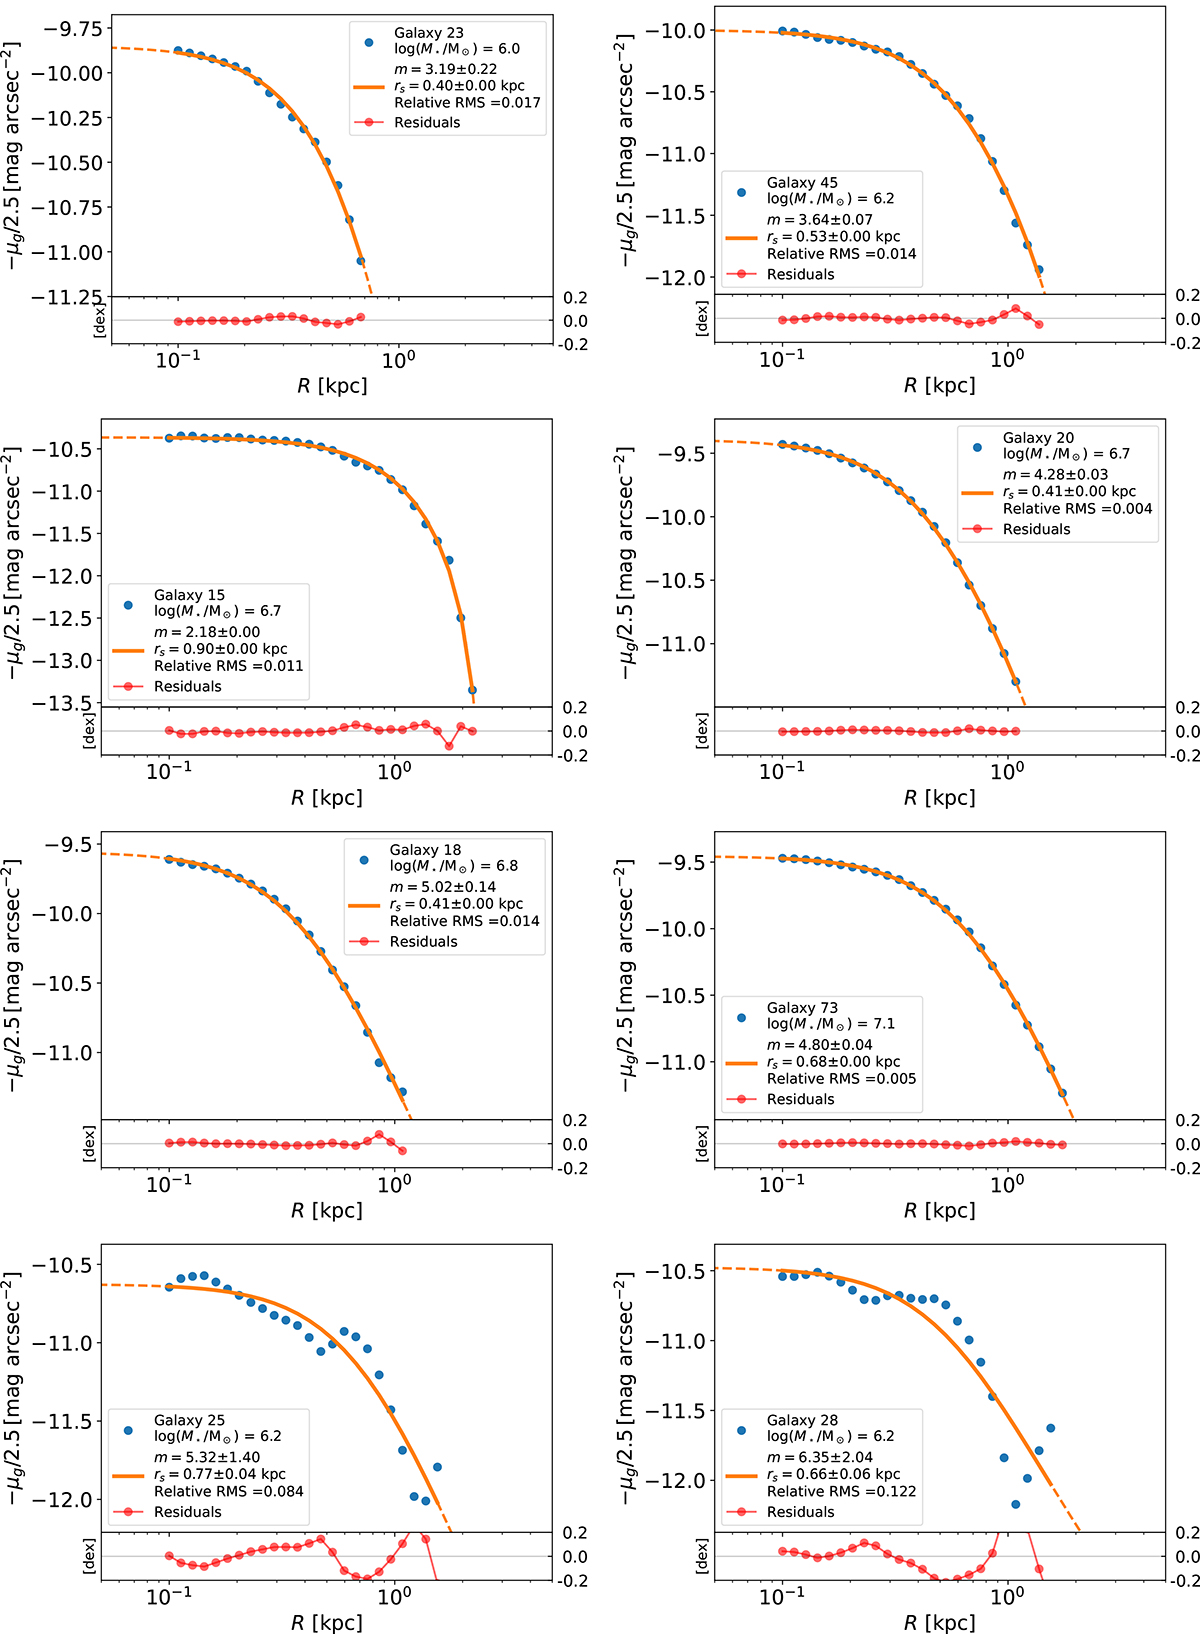
Examples of projected polytrope fits to some of the profiles in Fig. 1. The first three rows contain good fits. The bottom row shows examples of bad fits, usually profiles with bumps resulting from deviations from axial symmetry of the original galaxies. The blue dots represent the observed points, whereas the orange line shows the fit, which is solid or dashed depending on whether it is within or outside the range of fitted radii. The secondary subpanel in each panel shows the residuals of the fit. The insets provide information on the galaxy and the fit.
Current usage metrics show cumulative count of Article Views (full-text article views including HTML views, PDF and ePub downloads, according to the available data) and Abstracts Views on Vision4Press platform.
Data correspond to usage on the plateform after 2015. The current usage metrics is available 48-96 hours after online publication and is updated daily on week days.
Initial download of the metrics may take a while.