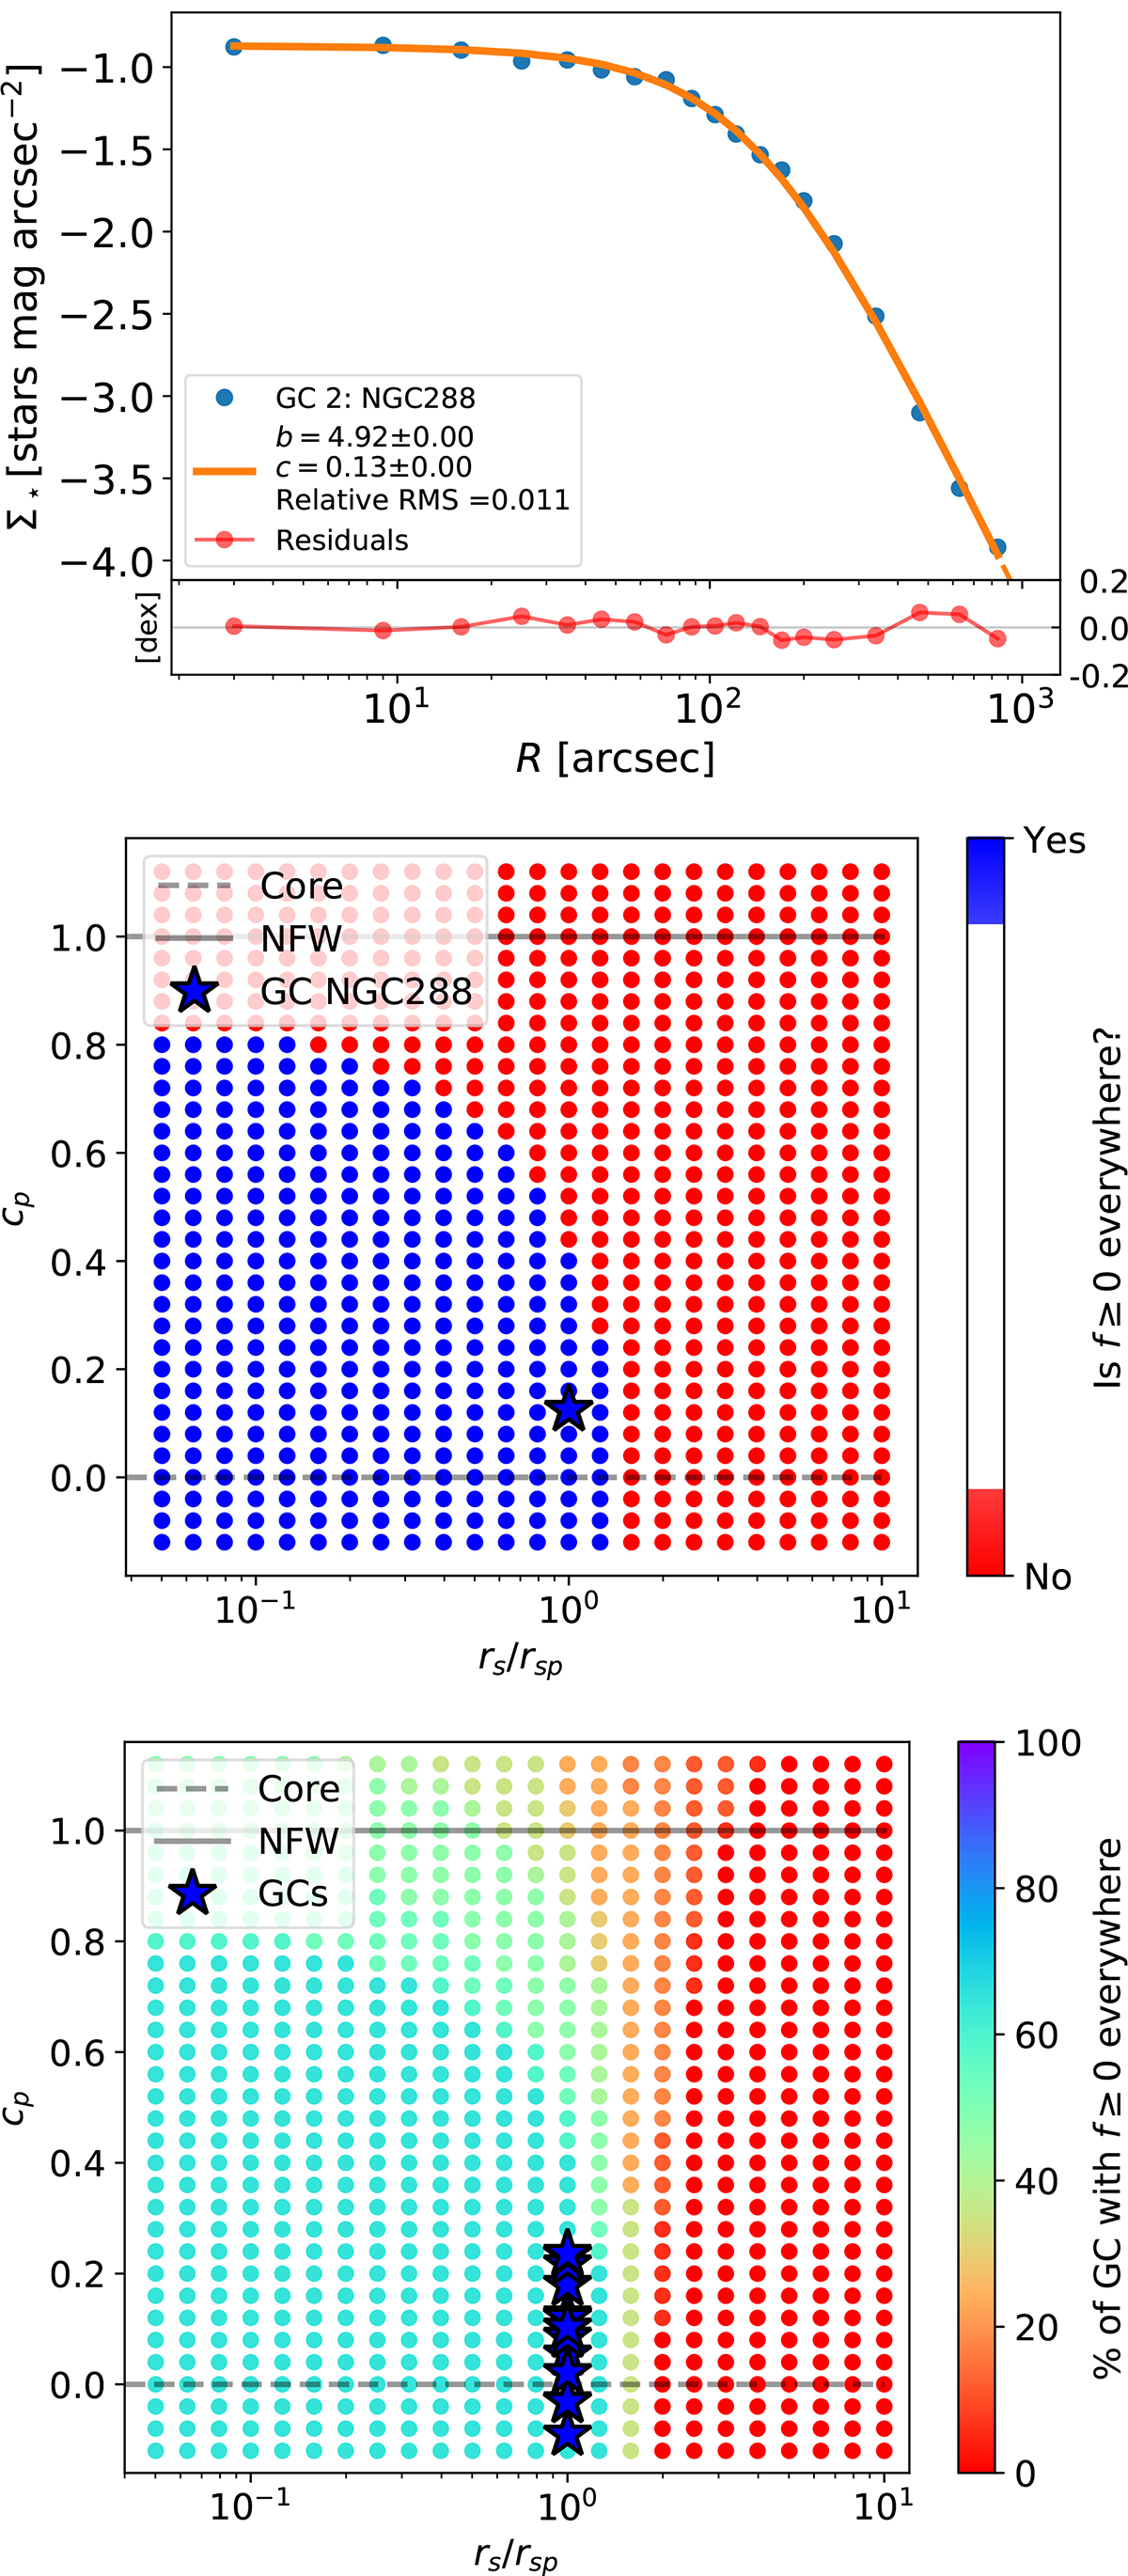
Fig. C.1.
Download original image
Sanity check employing GCs (from Miocchi et al. 2013), thought to be self-gravitating systems. Top panel: Fit to one of them, NGC 288. Middle panel: Diagnostic diagram for NGC 288 inferred from the above fit. Because it is self-gravitating, the parameters of the stellar distribution (indicated by the star symbol) are those of the true gravitational potential (rsp and cp), and they appear in the allowed region of the diagnostic diagram. Bottom panel: Diagnostic diagrams combining all GCs together. As in the middle panel, the star symbols indicated the true potentials, and they all fall well within the allowed region in the diagnostic plot.
Current usage metrics show cumulative count of Article Views (full-text article views including HTML views, PDF and ePub downloads, according to the available data) and Abstracts Views on Vision4Press platform.
Data correspond to usage on the plateform after 2015. The current usage metrics is available 48-96 hours after online publication and is updated daily on week days.
Initial download of the metrics may take a while.