Fig. 14.
Download original image
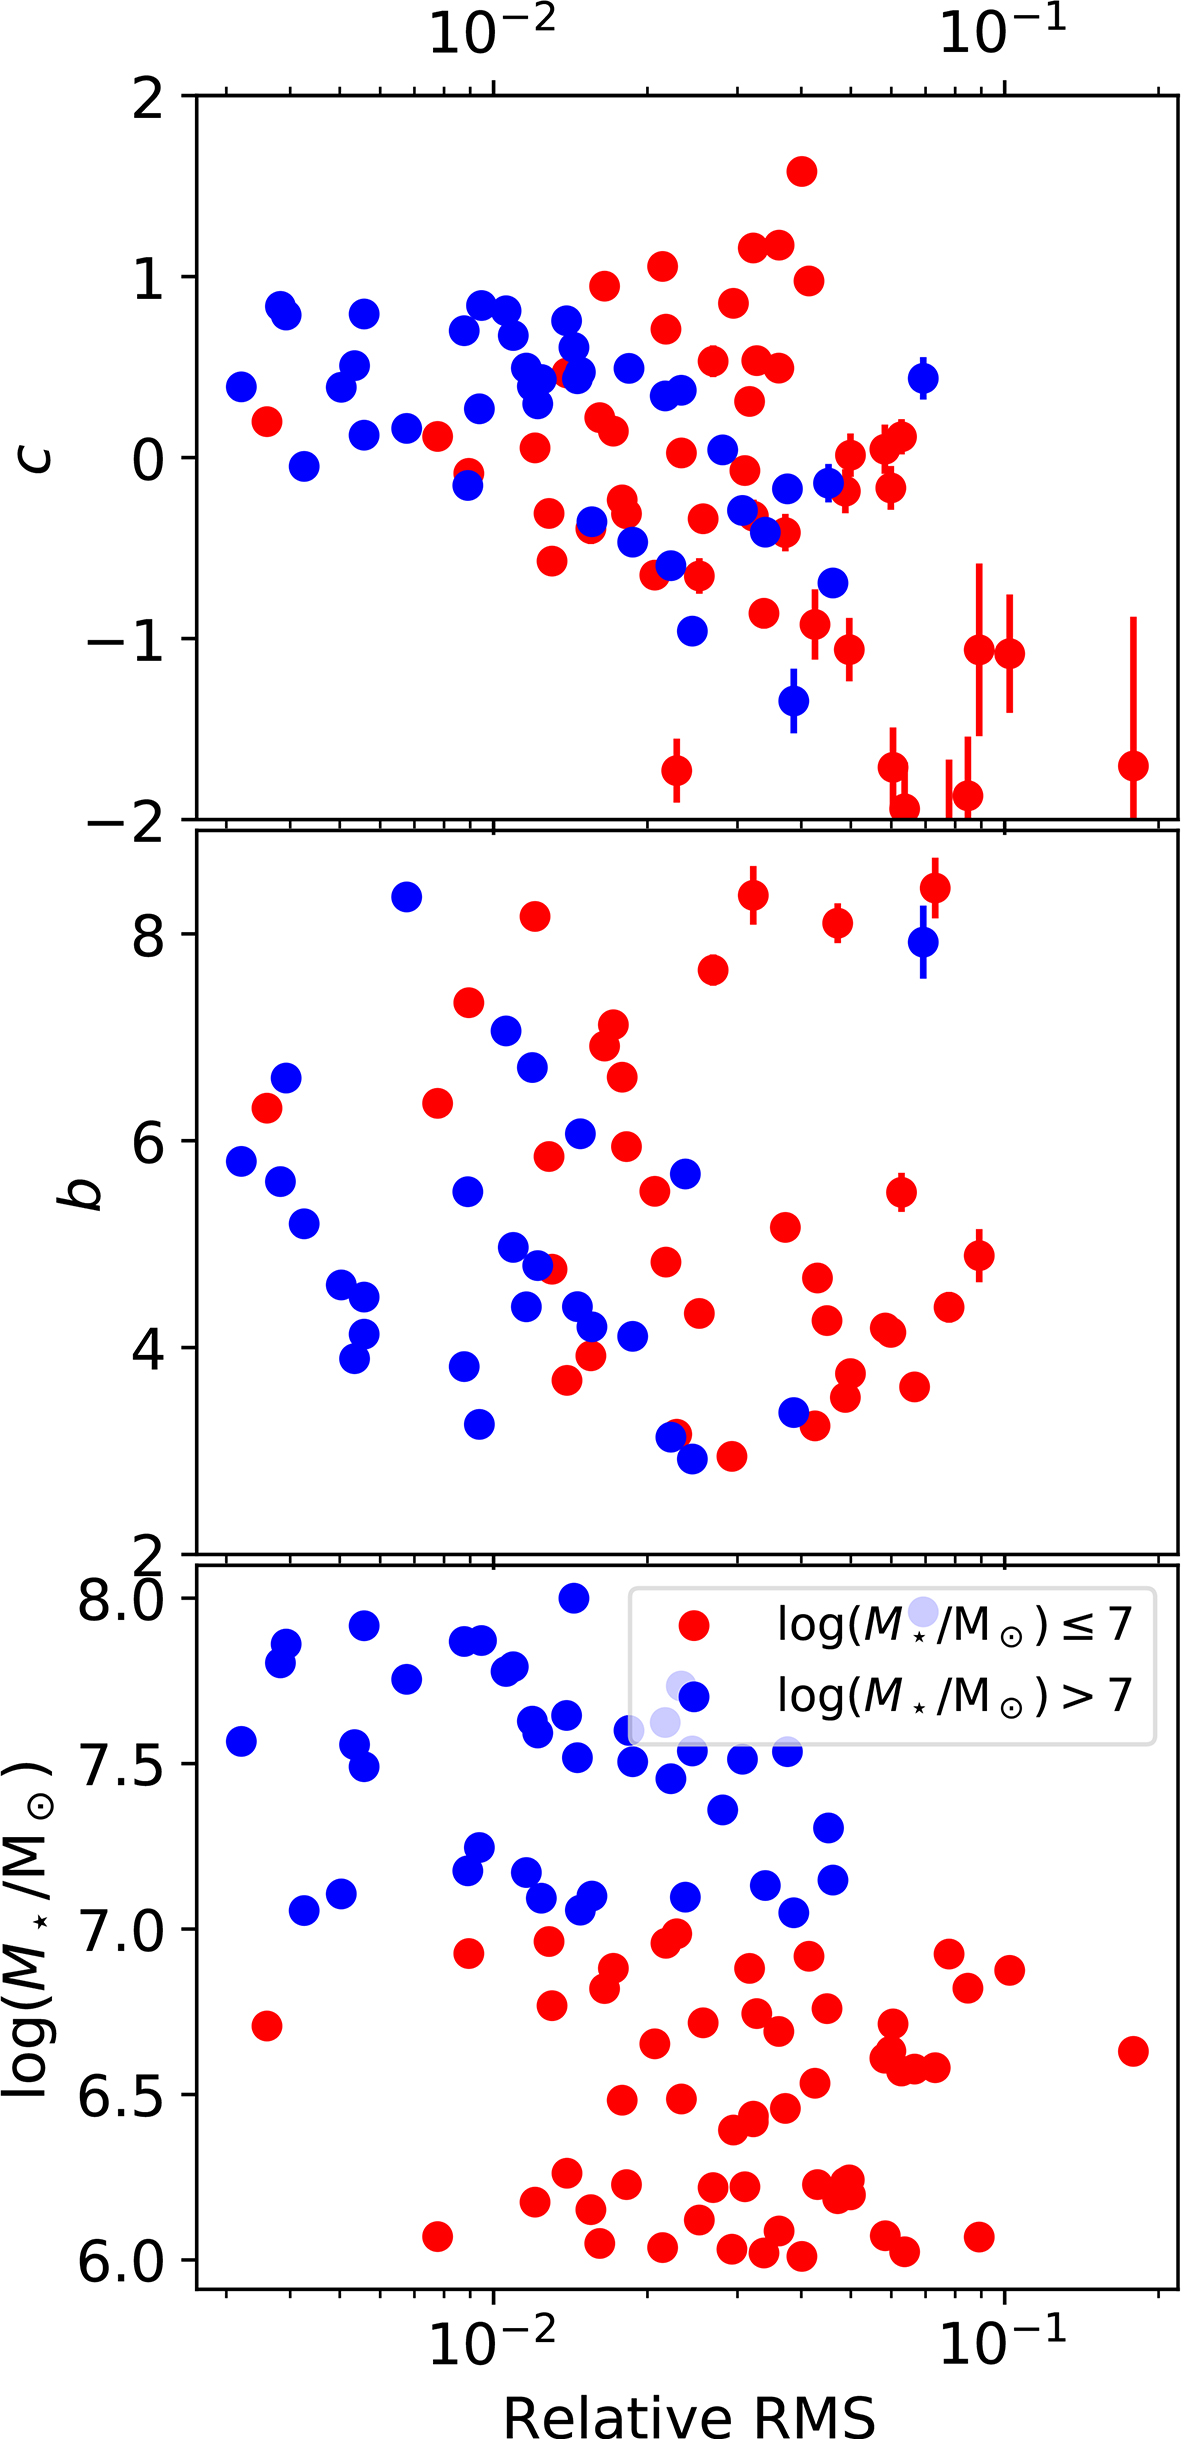
Summary of the results with free inner (c) and outer (b) slopes presented as a function of the Relative RMS of the fit. To be compared with Fig. 6, for the polytropes, and Fig. 10, for fits when only the inner slope is free. The color code separates low and high stellar mass galaxies, as indicated in the inset. Top panel: Inner slope. See how often c < 0, particularly for poor fits. Middle panel: Outer slope. For reference, b = 5 in the case of polytropic fits with m = 5, which is the largest m for good polytropic fits (Fig. 6). Bottom panel: Stellar mass. Lower-mass galaxies tend to have poorer fits.
Current usage metrics show cumulative count of Article Views (full-text article views including HTML views, PDF and ePub downloads, according to the available data) and Abstracts Views on Vision4Press platform.
Data correspond to usage on the plateform after 2015. The current usage metrics is available 48-96 hours after online publication and is updated daily on week days.
Initial download of the metrics may take a while.