Fig. 13.
Download original image
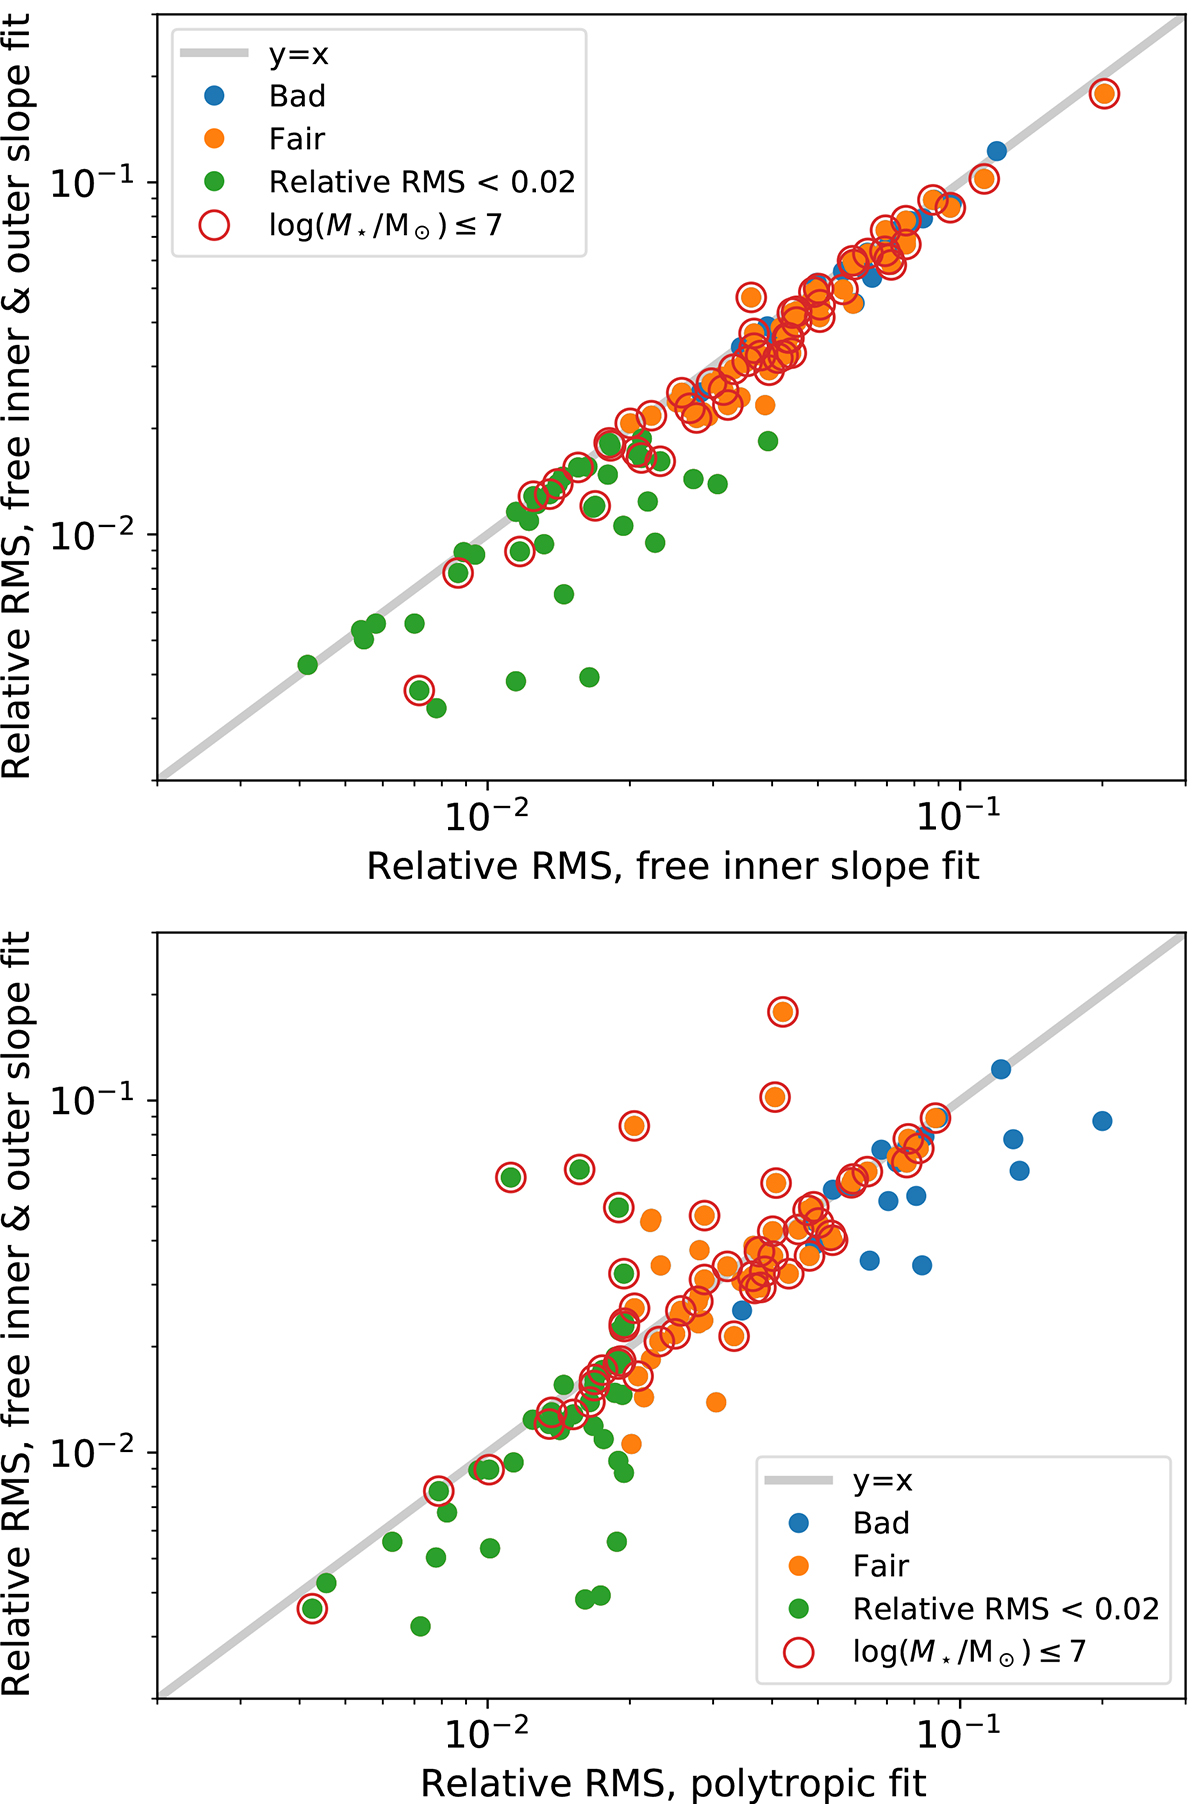
Scatter plots of Relative RMS. Top panel: Scatter plot of the Relative RMS from the variable inner and outer slope fits versus the variable inner slope fits. It is clear that the variable inner and outer slope fits generally have a lower RMS, as expected since the underlying shape is the same and the former has one more degree of freedom. Bottom panel: Scatter plot of the Relative RMS from the variable inner and outer slope fits versus polytropic fits. The colors and symbols are the same as in Fig. 9.
Current usage metrics show cumulative count of Article Views (full-text article views including HTML views, PDF and ePub downloads, according to the available data) and Abstracts Views on Vision4Press platform.
Data correspond to usage on the plateform after 2015. The current usage metrics is available 48-96 hours after online publication and is updated daily on week days.
Initial download of the metrics may take a while.