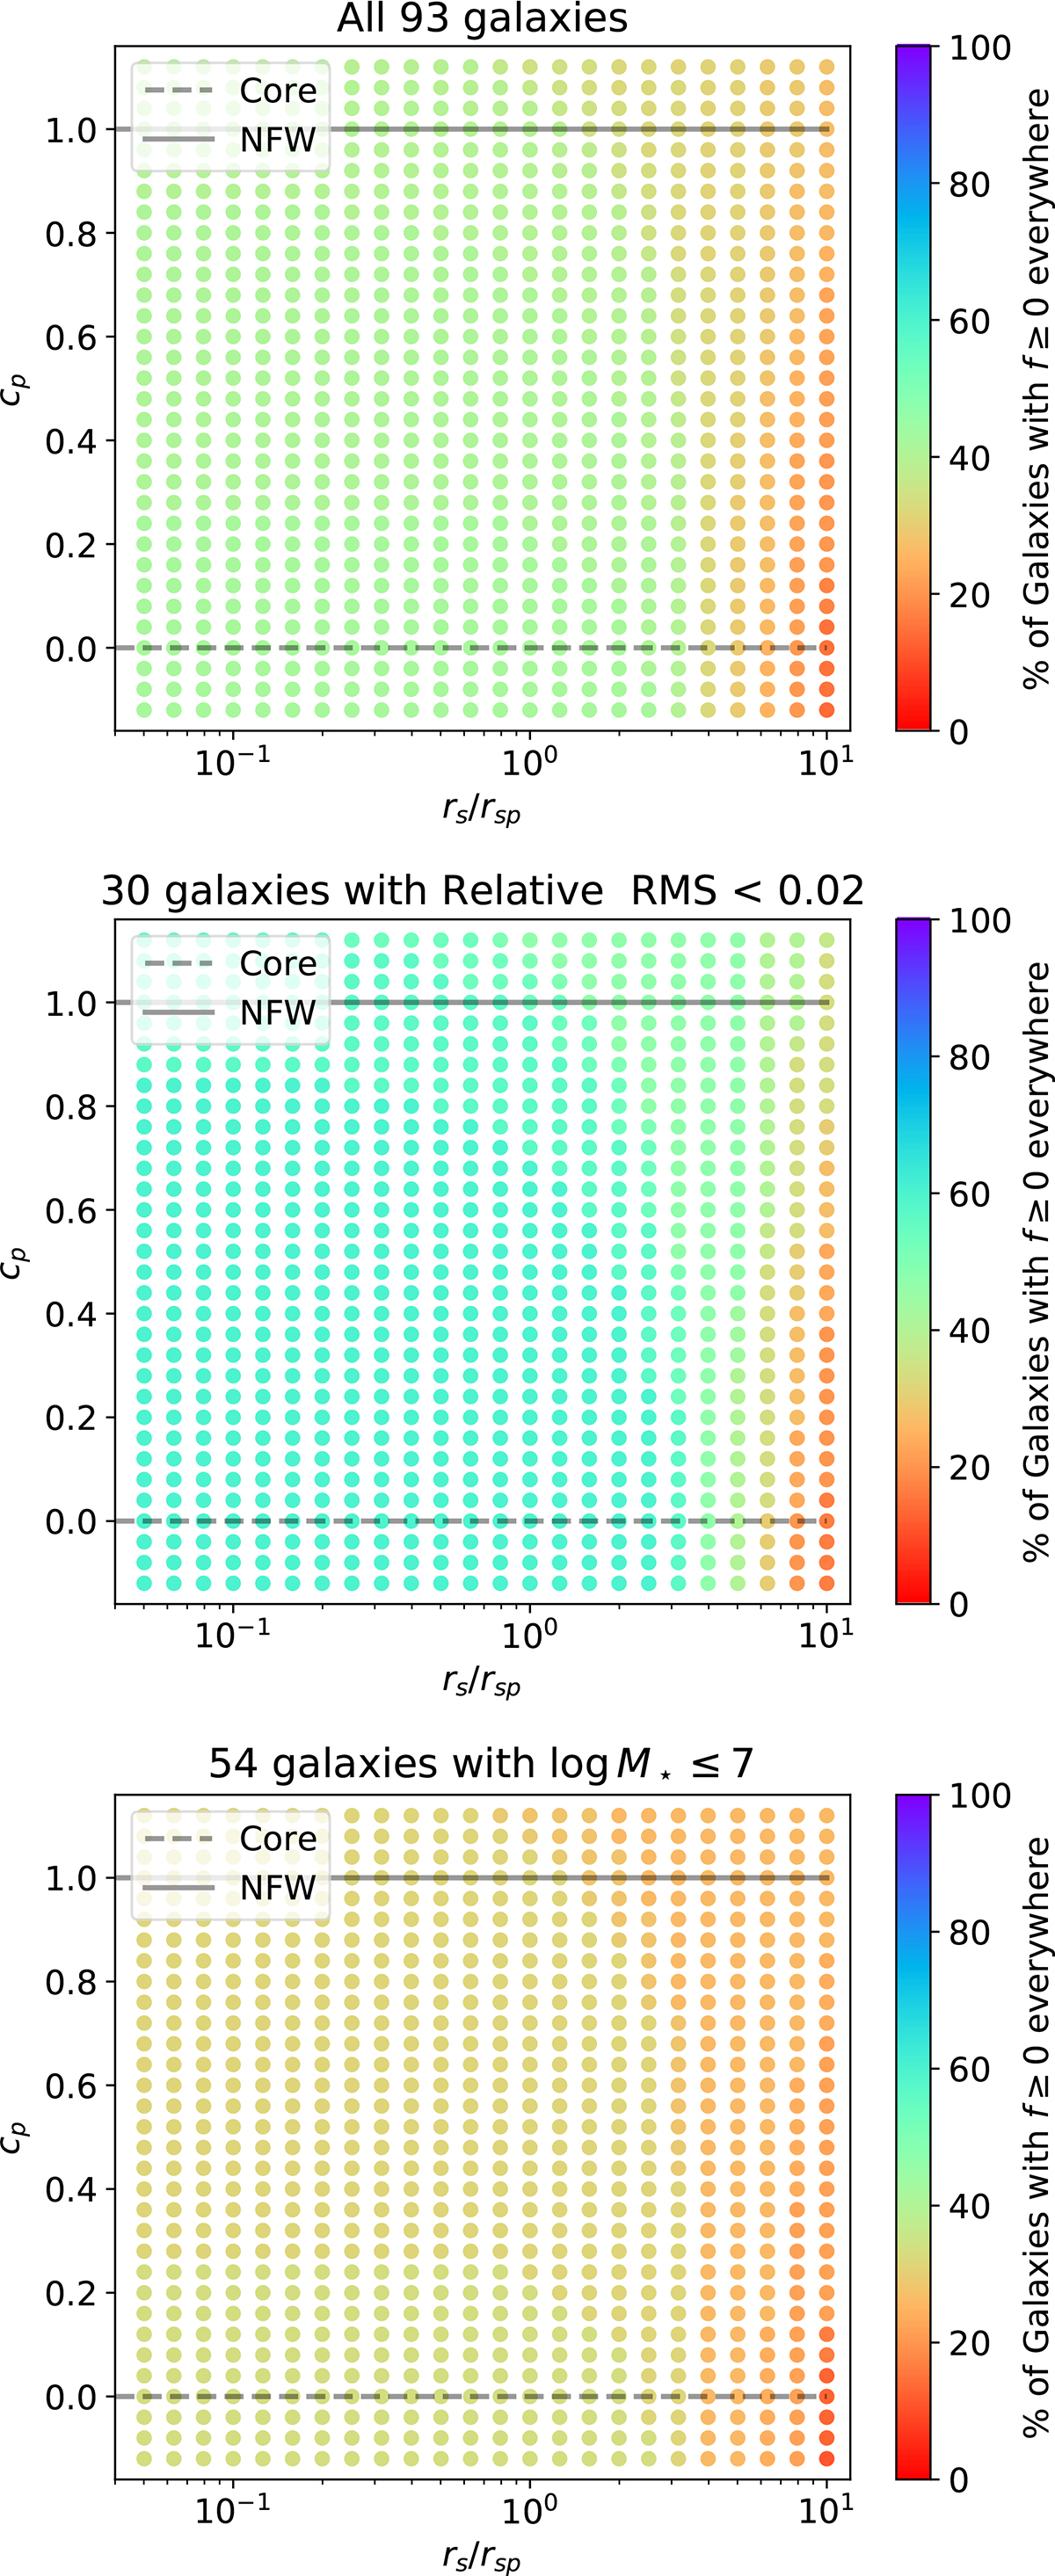
Fig. 12.
Download original image
Constraints on the underlying gravitational potential imposed by the variable inner slope fits. Top panel: Diagnostic diagram, equivalent to Fig. 5 for the polytropic fits, which includes all galaxies together. Note that around half of the galaxies have unphysical f < 0 irrespectively of the inner slope of the potential (cp), a percentage that increases as rs/rsp increases. This is mostly due to the inner slope, c, being negative for a number of galaxies. Middle panel: Same as the top panel but including only good fits (Relative RMS < 0.02). Note how the fraction of unphysical potentials with f < 0 has been significantly reduced (the tone becomes bluish rather than greenish). Bottom panel: Same as the top panel but including only low-mass galaxies (M⋆< 107 M⊙). As expected, the fraction of potentials with f < 0 increases (the tone becomes reddish) due to the increase in fits with c< 0. The color bar shows the percentage of galaxies with f ≥ 0.
Current usage metrics show cumulative count of Article Views (full-text article views including HTML views, PDF and ePub downloads, according to the available data) and Abstracts Views on Vision4Press platform.
Data correspond to usage on the plateform after 2015. The current usage metrics is available 48-96 hours after online publication and is updated daily on week days.
Initial download of the metrics may take a while.