Open Access
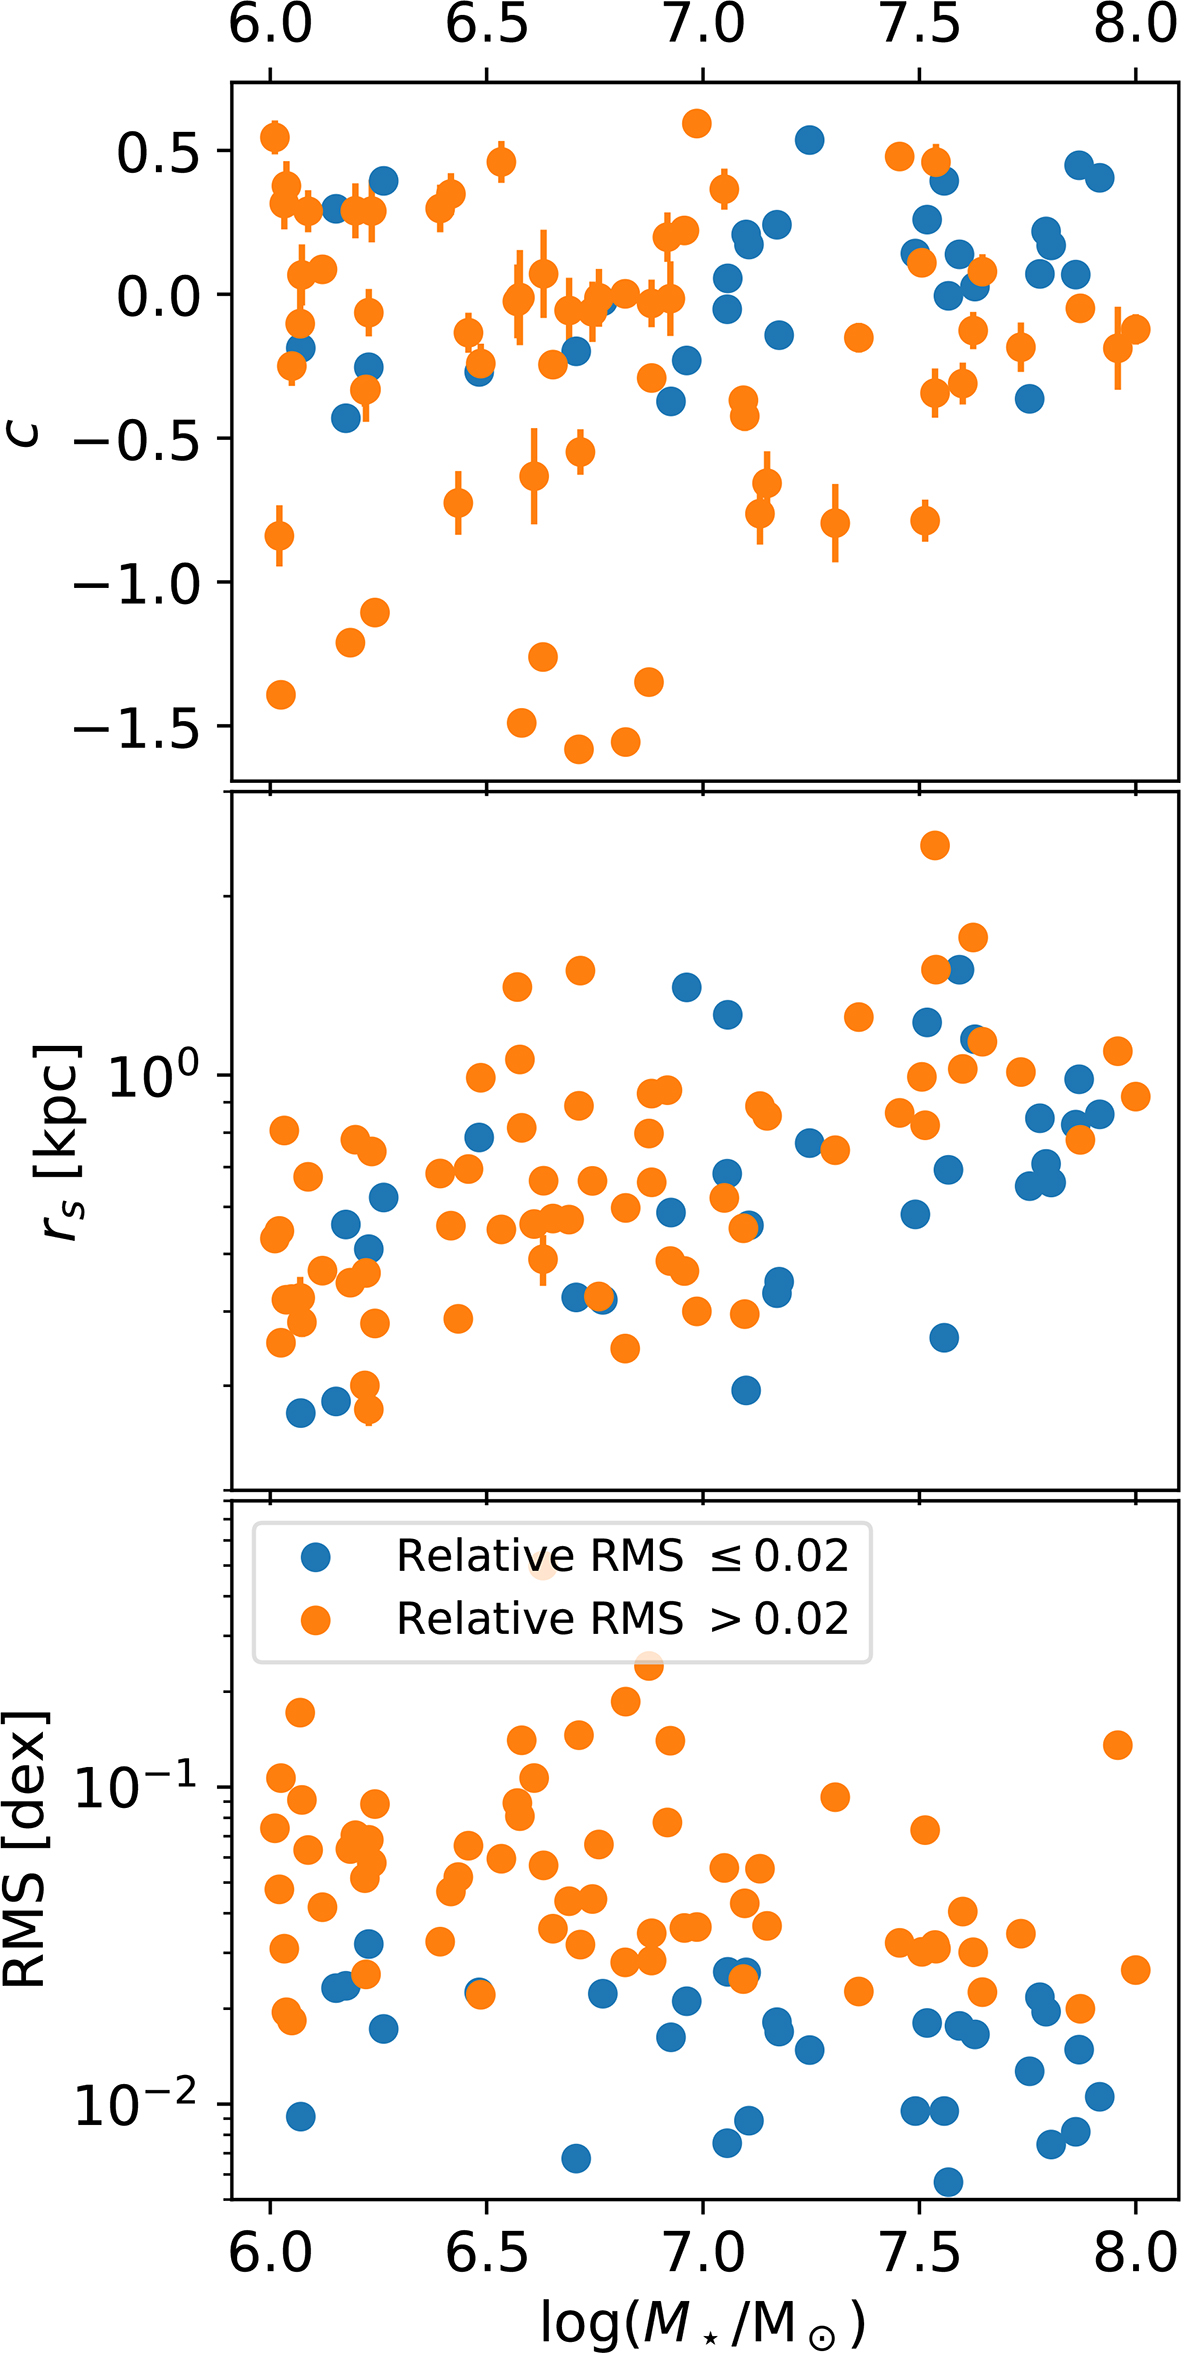
Fig. 11.
Download original image
Quantitative summary with the results of the variable inner slope fit. Except for the inner slope c replacing the polytropic index, the figure is similar to Fig. 7 describing the polytropic fits.
Current usage metrics show cumulative count of Article Views (full-text article views including HTML views, PDF and ePub downloads, according to the available data) and Abstracts Views on Vision4Press platform.
Data correspond to usage on the plateform after 2015. The current usage metrics is available 48-96 hours after online publication and is updated daily on week days.
Initial download of the metrics may take a while.