Fig. 1.
Download original image
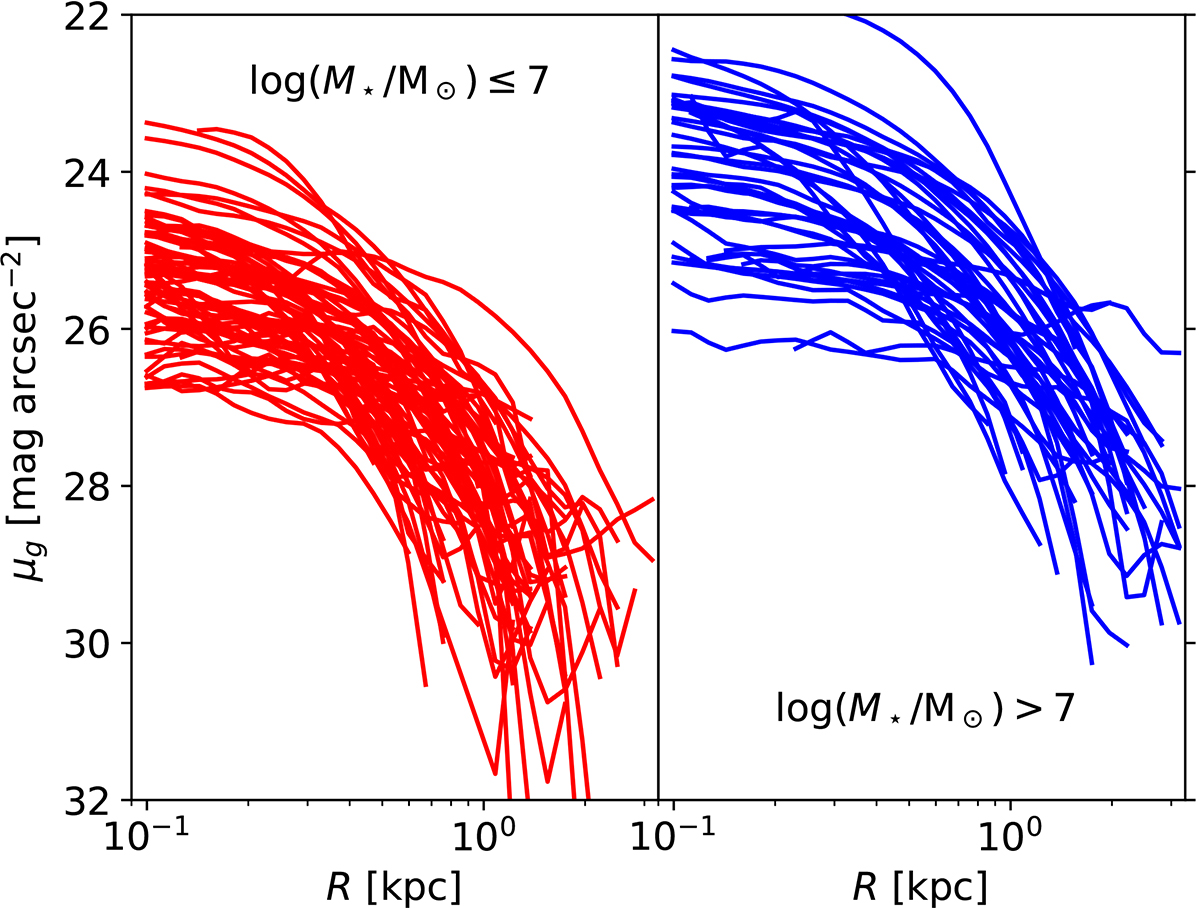
Surface brightness profiles in the g band for the early-type galaxies in Carlsten et al. (2021, 2022). The left panel shows stellar masses between 106 and 107 M⊙, whereas the right panel corresponds to masses between 107 and 108 M⊙. Note how the profiles tend to present a central plateau or core. This color code is maintained in Figs. 6, 10, and 14.
Current usage metrics show cumulative count of Article Views (full-text article views including HTML views, PDF and ePub downloads, according to the available data) and Abstracts Views on Vision4Press platform.
Data correspond to usage on the plateform after 2015. The current usage metrics is available 48-96 hours after online publication and is updated daily on week days.
Initial download of the metrics may take a while.