Fig. 8
Download original image
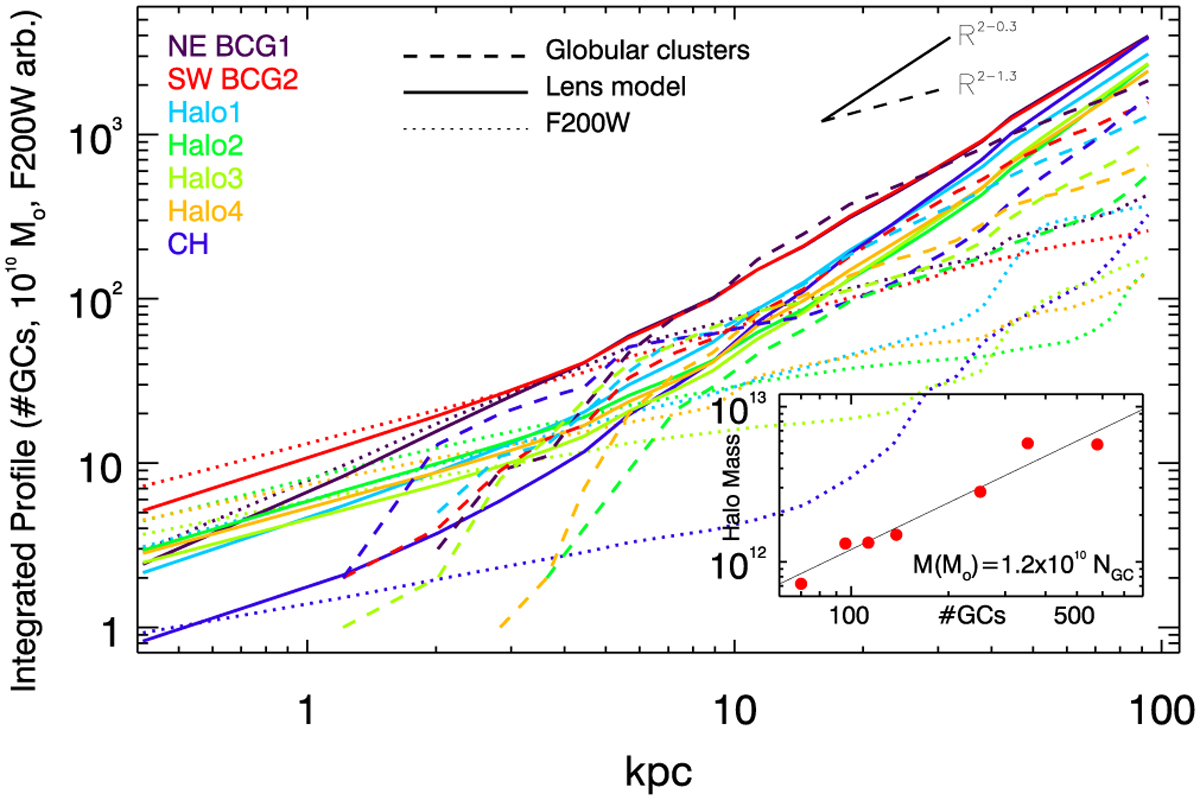
Profiles of the lensing mass, number of GCs, and light around seven halos. The solid lines show the projected mass profiles from the lens model as a function of radius, the dashed lines show the corresponding number-density profile of GCs, and the dotted lines show the F200W surface brightness. The profiles are centered on each of the seven halos identified in Fig. 6 and plotted in different colors as shown in the legend. The inset shows the total mass versus number of GCs for each halo integrated up to the radius of the halo’s yellow circle in Fig. 6. The solid line in the inset shows the relation M = 1.2 × 10¹⁰NGC.
Current usage metrics show cumulative count of Article Views (full-text article views including HTML views, PDF and ePub downloads, according to the available data) and Abstracts Views on Vision4Press platform.
Data correspond to usage on the plateform after 2015. The current usage metrics is available 48-96 hours after online publication and is updated daily on week days.
Initial download of the metrics may take a while.