Fig. 5
Download original image
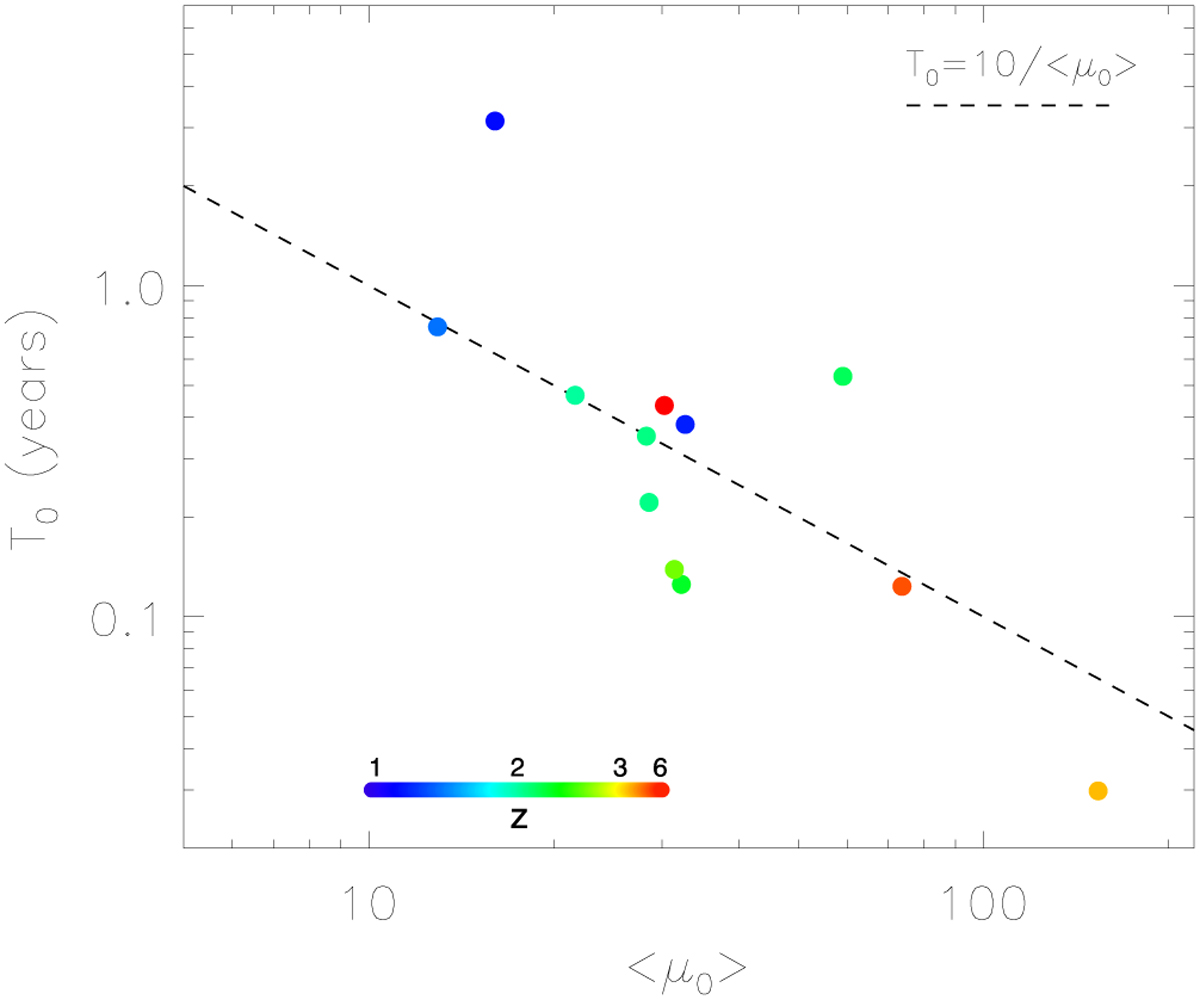
Magnification versus time delay normalization factors for the 12 caustic-crossing galaxies in MACS0416. Each point represents one of the 12 galaxies color-coded by their redshift. Low-redshift arcs normally appear near the center of the cluster, which gives larger Shapiro delays and steeper potentials. That largely explains the larger delays for smaller magnification factors. The x-axis shows the average of the two normalization factors ![]() for each arc. The dashed line shows the expected scaling for an isothermal model.
for each arc. The dashed line shows the expected scaling for an isothermal model.
Current usage metrics show cumulative count of Article Views (full-text article views including HTML views, PDF and ePub downloads, according to the available data) and Abstracts Views on Vision4Press platform.
Data correspond to usage on the plateform after 2015. The current usage metrics is available 48-96 hours after online publication and is updated daily on week days.
Initial download of the metrics may take a while.