Fig. 3
Download original image
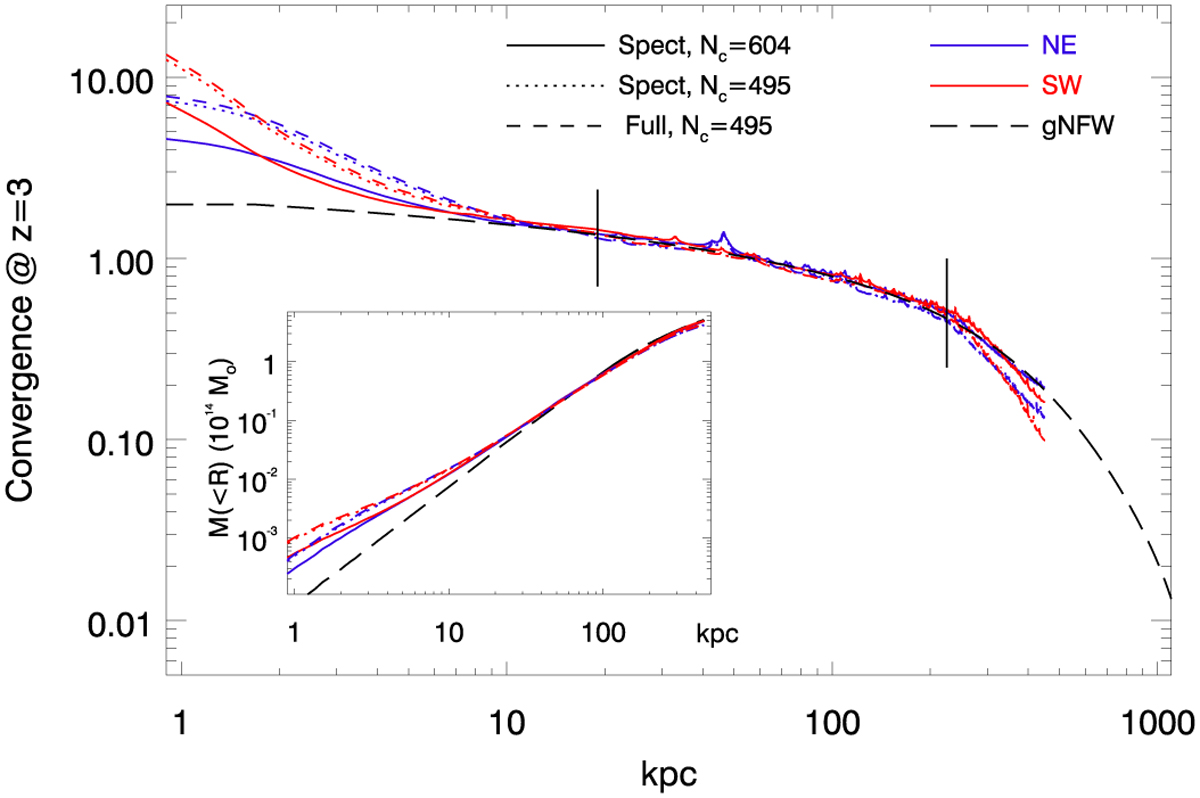
Mass profile of the lens models. Blue curves correspond to profiles centered on the NE BCG while red curves are for profiles centered at the SW BCG. Solid lines represent the models derived using only spectroscopically confirmed (rank A in Table B.1) galaxies as constraints and an adaptive grid with 604 grid points for the smooth DM. Dotted lines show the corresponding solution for an alternative model with the same constraints (rank A) but with only 495 grid points. Dashed lines represent the same 495-point grid but with the full sample of lensed systems ranked A and B (geometric redshifts) as constraints. The mass profiles are given in dimensionless κ units assuming a source at z = 3. The long-dashed line shows a gNFW profile with parameters (Eq. (3)) γ = 0.9, α = 2, β = 3, and scale radius rs = 640 kpc. The two vertical black segments indicate the distance interval where the profiles are constrained by lensing. The inset shows the integrated mass as a function of radius in units of 1014 M⊙ for the same three profiles shown in the main panel. The black long-dashed line is the integrated profile when the center is chosen as the midpoint between the two BCGs (RA = 4hr16m08s.428, Dec = –24°04′21″.0).
Current usage metrics show cumulative count of Article Views (full-text article views including HTML views, PDF and ePub downloads, according to the available data) and Abstracts Views on Vision4Press platform.
Data correspond to usage on the plateform after 2015. The current usage metrics is available 48-96 hours after online publication and is updated daily on week days.
Initial download of the metrics may take a while.