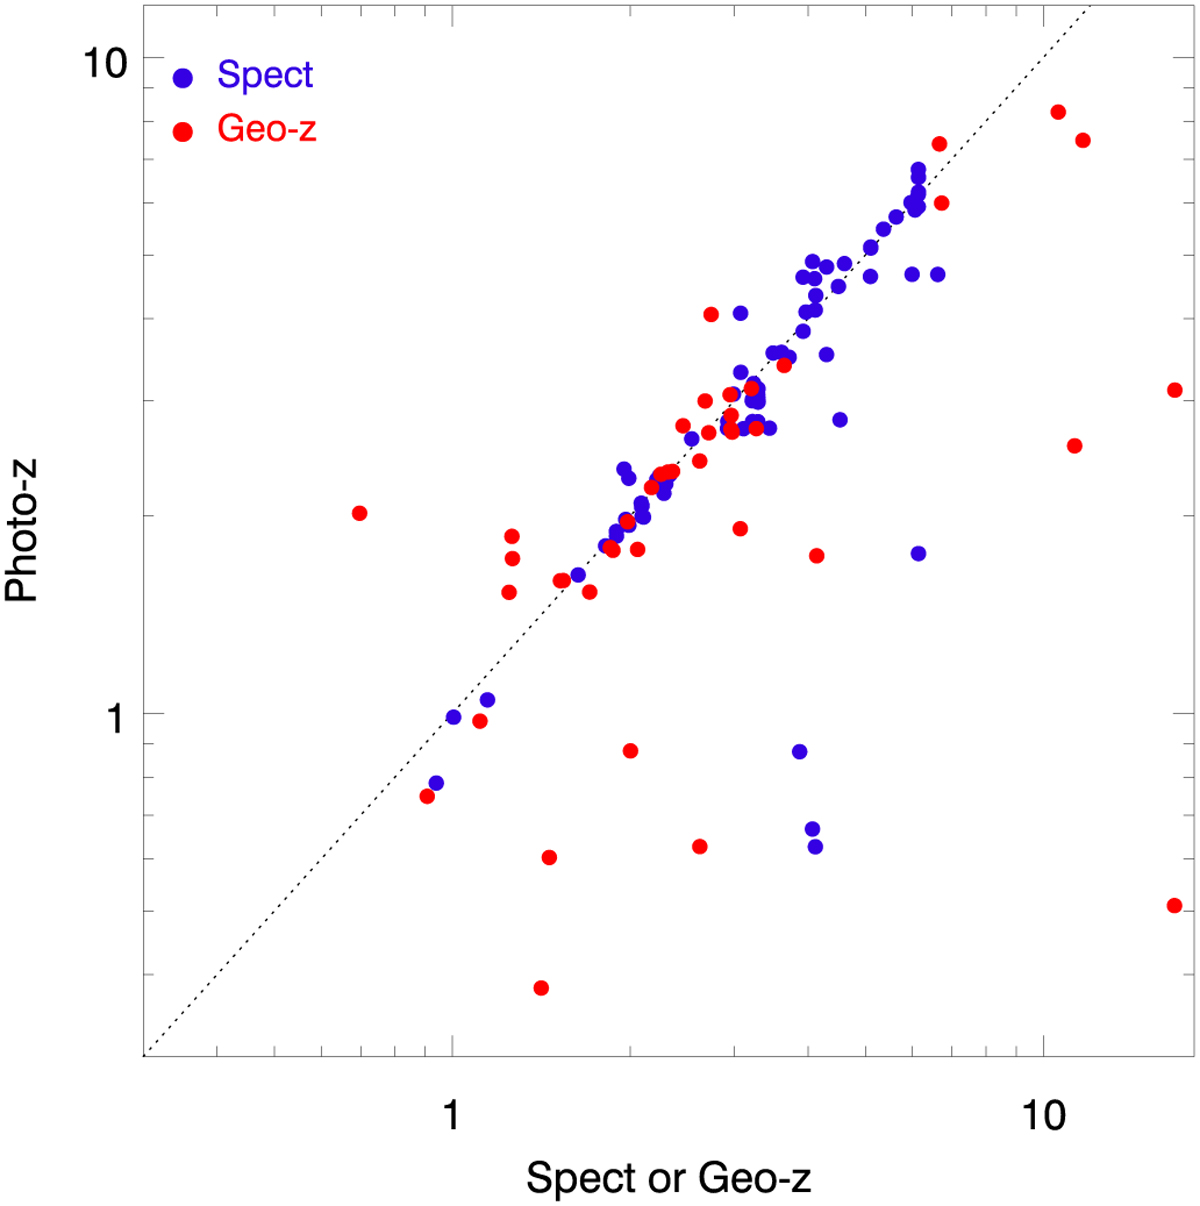
Fig. 2
Download original image
Comparison of photometric redshifts with spectroscopic (blue symbols) or geometric (red symbols) redshifts for the lensed systems in Table B.1. For the photometric redshifts, we chose the value (from the multiple counterimages of the same system) closest to the spect-z or geo-z. The dotted line shows equality. The comparison between spect-z and geo-z is not shown but it follows almost perfectly the dotted line (see Table B.1).
Current usage metrics show cumulative count of Article Views (full-text article views including HTML views, PDF and ePub downloads, according to the available data) and Abstracts Views on Vision4Press platform.
Data correspond to usage on the plateform after 2015. The current usage metrics is available 48-96 hours after online publication and is updated daily on week days.
Initial download of the metrics may take a while.