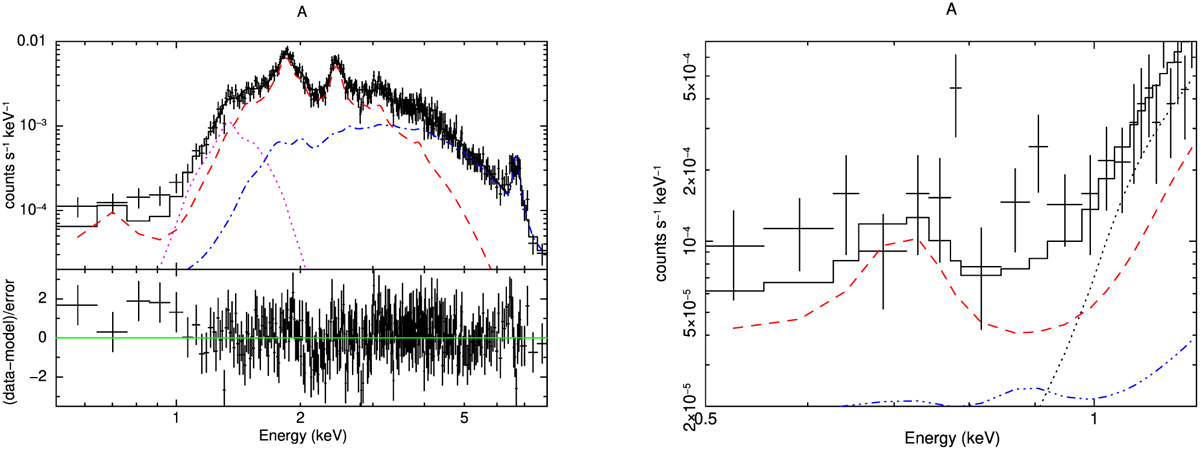
Fig. 7
Download original image
Spectral modelling of star A. Left: combined spectrum of star A along with the best-fit model consisting of three vapec components (for solar composition). The fit residuals are shown in terms of sigma with error bars of size 1σ. Right: same spectrum as in the left panel but at low energies (<1.5 keV), using a grouping of 5 counts per bin.
Current usage metrics show cumulative count of Article Views (full-text article views including HTML views, PDF and ePub downloads, according to the available data) and Abstracts Views on Vision4Press platform.
Data correspond to usage on the plateform after 2015. The current usage metrics is available 48-96 hours after online publication and is updated daily on week days.
Initial download of the metrics may take a while.