Fig. 3
Download original image
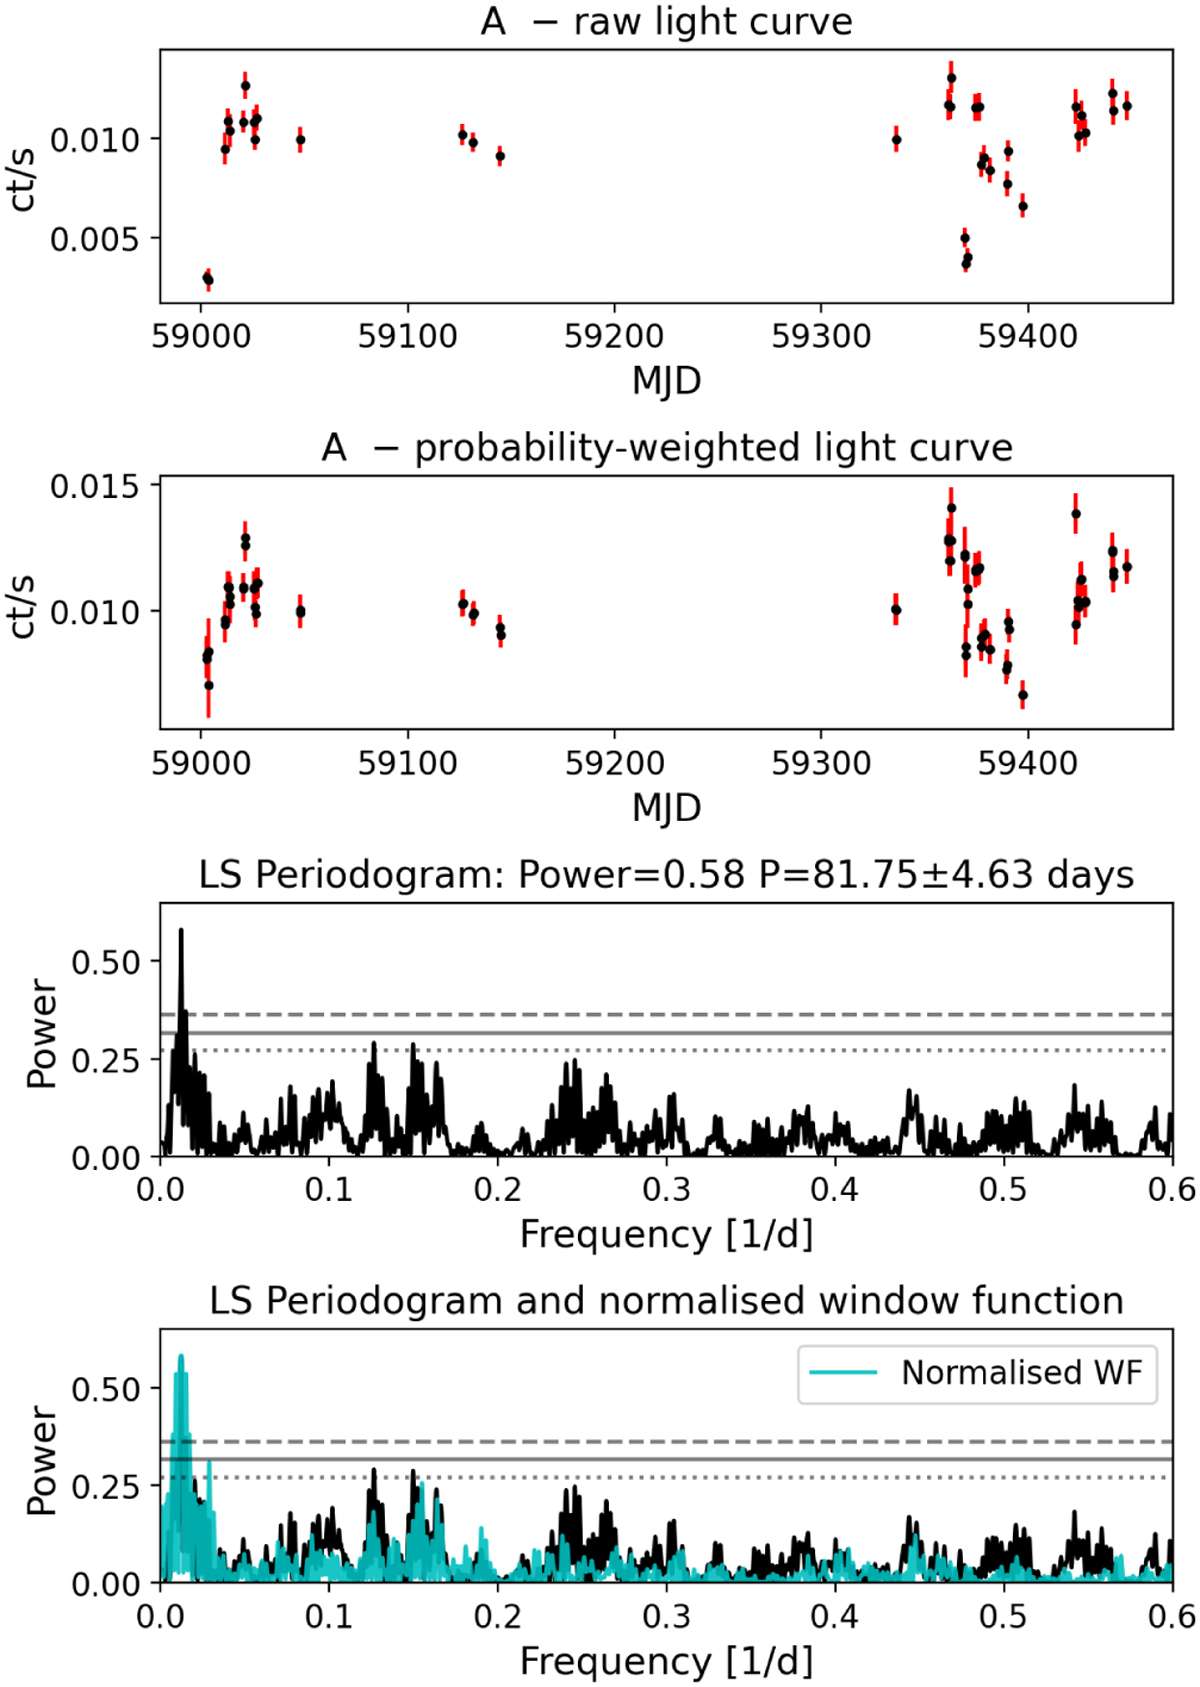
EWOCS light curves and periodogram of star A. Top panel: broad-band raw light curve produced by the dmextract tool. Second panel: broad-band probability-weighted light curve produced by the glvary tool. Third panel: resulting LS periodogram and the FAP levels of 0.01, 0.1, and 1% are marked with the dashed, solid, and dotted horizontal lines. A clear peak at about 81 days is detected. Bottom panel: Same as third panel, with the normalised window function overlaid on the periodogram.
Current usage metrics show cumulative count of Article Views (full-text article views including HTML views, PDF and ePub downloads, according to the available data) and Abstracts Views on Vision4Press platform.
Data correspond to usage on the plateform after 2015. The current usage metrics is available 48-96 hours after online publication and is updated daily on week days.
Initial download of the metrics may take a while.