Fig. 2
Download original image
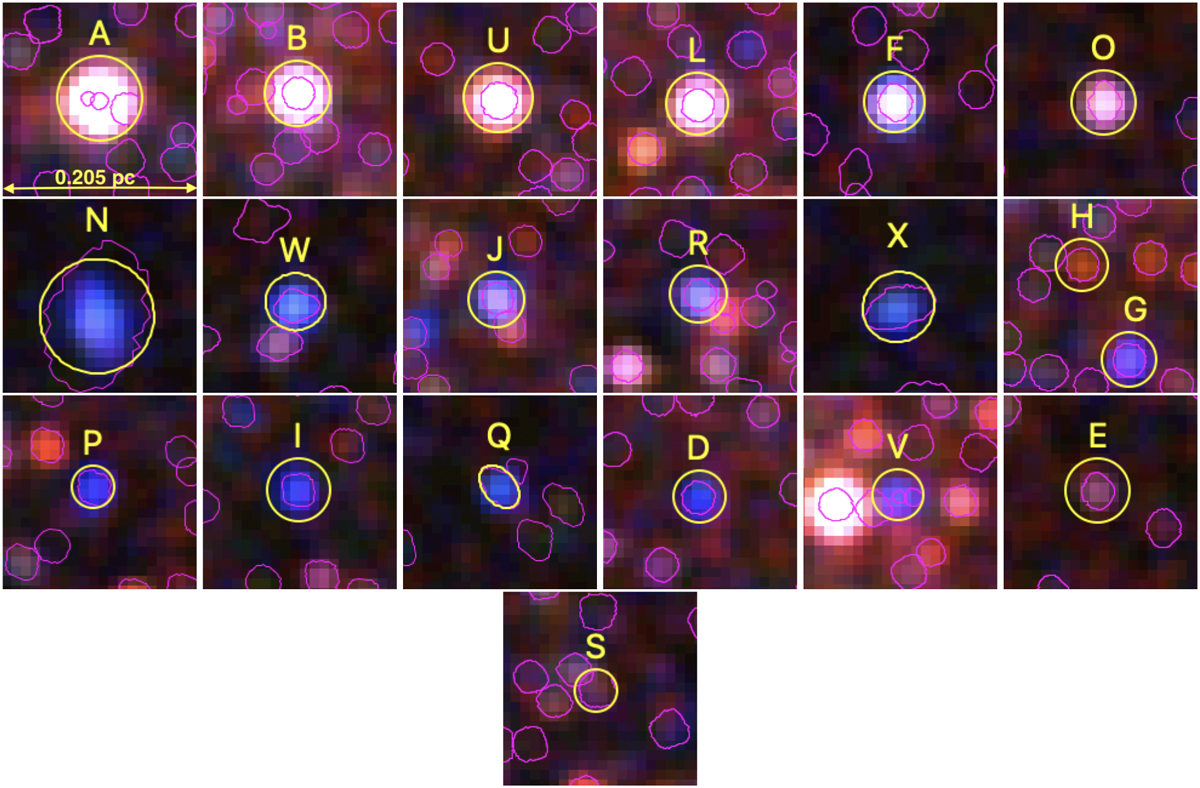
X-ray-detected WR population in Wd1. We present the X-ray-brightest WR star from the top left panel and moving rightwards the X-ray brightness decreases. Each panel has a size of 10″ × 10″ and the colour coding is the same as in Fig. 1. The yellow regions are shown just for illustration purposes centred at the X-ray coordinates of the WR stars, while the magenta regions correspond to the extraction regions of detected sources used for photometry and spectral analysis, except for star A where a larger extraction region was used (Sec. 3.1).
Current usage metrics show cumulative count of Article Views (full-text article views including HTML views, PDF and ePub downloads, according to the available data) and Abstracts Views on Vision4Press platform.
Data correspond to usage on the plateform after 2015. The current usage metrics is available 48-96 hours after online publication and is updated daily on week days.
Initial download of the metrics may take a while.