Open Access
Fig. A.1
Download original image
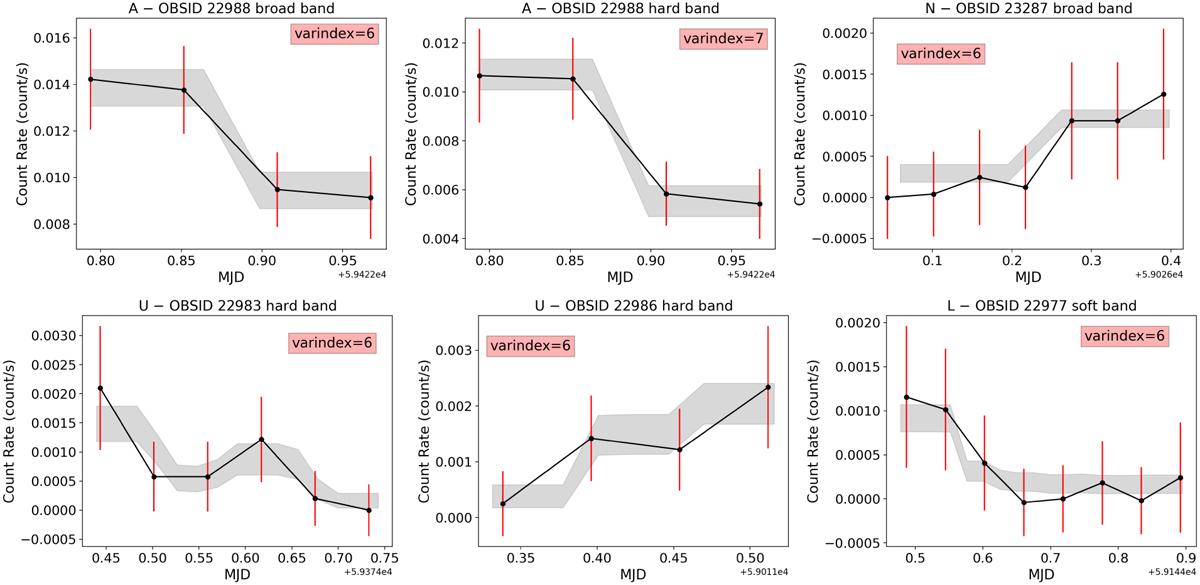
Light curves of the single observations where short-term variability is detected. The raw light curves produced with the dmextract tool are shown with the black line, with a time binning of 5ks. The probability-weighted light curves and their 3σ errors obtained with the glvary tool are shown with the shaded area.
Current usage metrics show cumulative count of Article Views (full-text article views including HTML views, PDF and ePub downloads, according to the available data) and Abstracts Views on Vision4Press platform.
Data correspond to usage on the plateform after 2015. The current usage metrics is available 48-96 hours after online publication and is updated daily on week days.
Initial download of the metrics may take a while.