Fig. 5.
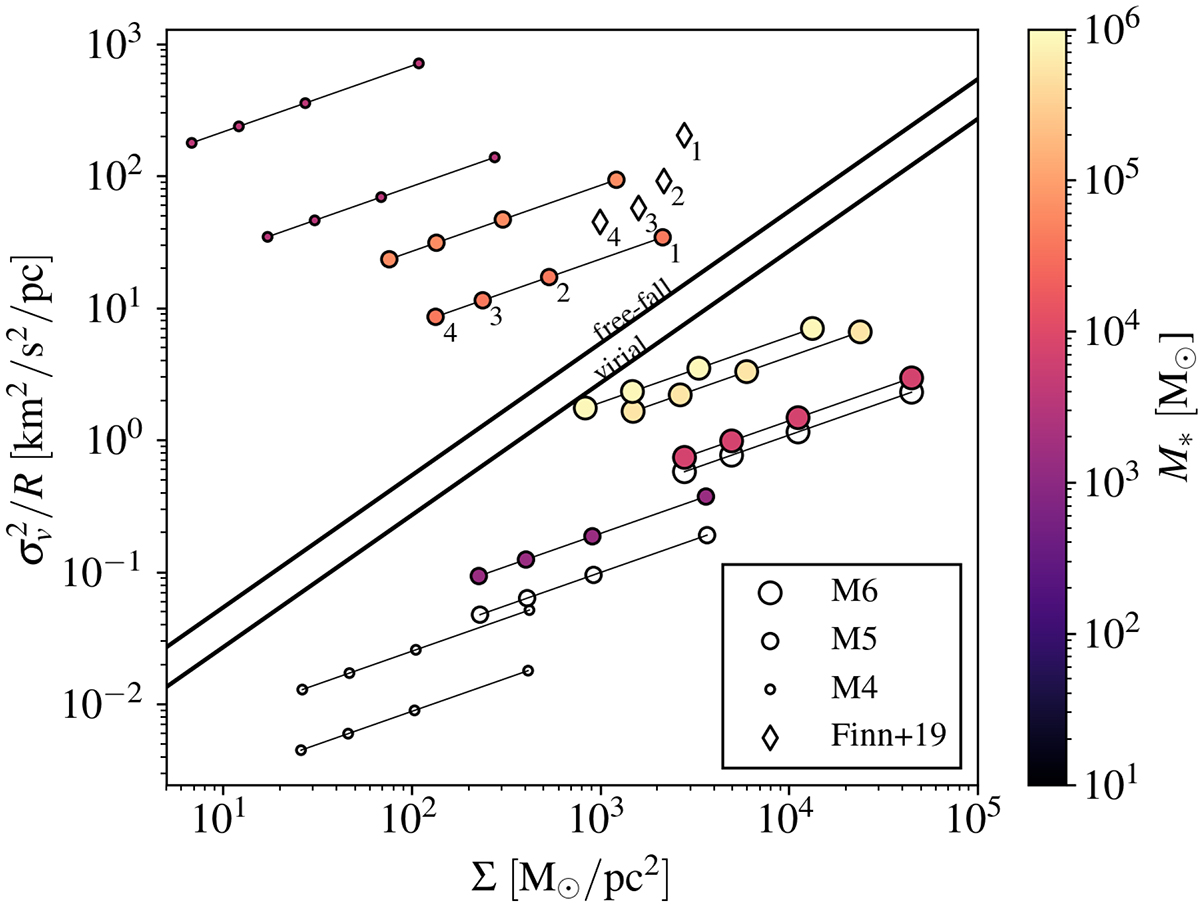
Download original image
Size-line width coefficient versus surface density for the Firecracker cloud (Finn et al. 2019) and the M4, M5, and M6 clouds. The four red diamonds are observations, done using apertures (1–4) with radii R = 6.4, 15, 26, and 37 pc. The other points are our simulations, with connected points corresponding to apertures (1–4) of radii R = 5, 10, 15 and 20 pc. The colors indicate how much stellar mass has been produced (with empty points indicating no star formation). The lines correspond to virial equilibrium and free-fall as labeled (see Fig. 2 of Ballesteros-Paredes et al. 2011).
Current usage metrics show cumulative count of Article Views (full-text article views including HTML views, PDF and ePub downloads, according to the available data) and Abstracts Views on Vision4Press platform.
Data correspond to usage on the plateform after 2015. The current usage metrics is available 48-96 hours after online publication and is updated daily on week days.
Initial download of the metrics may take a while.