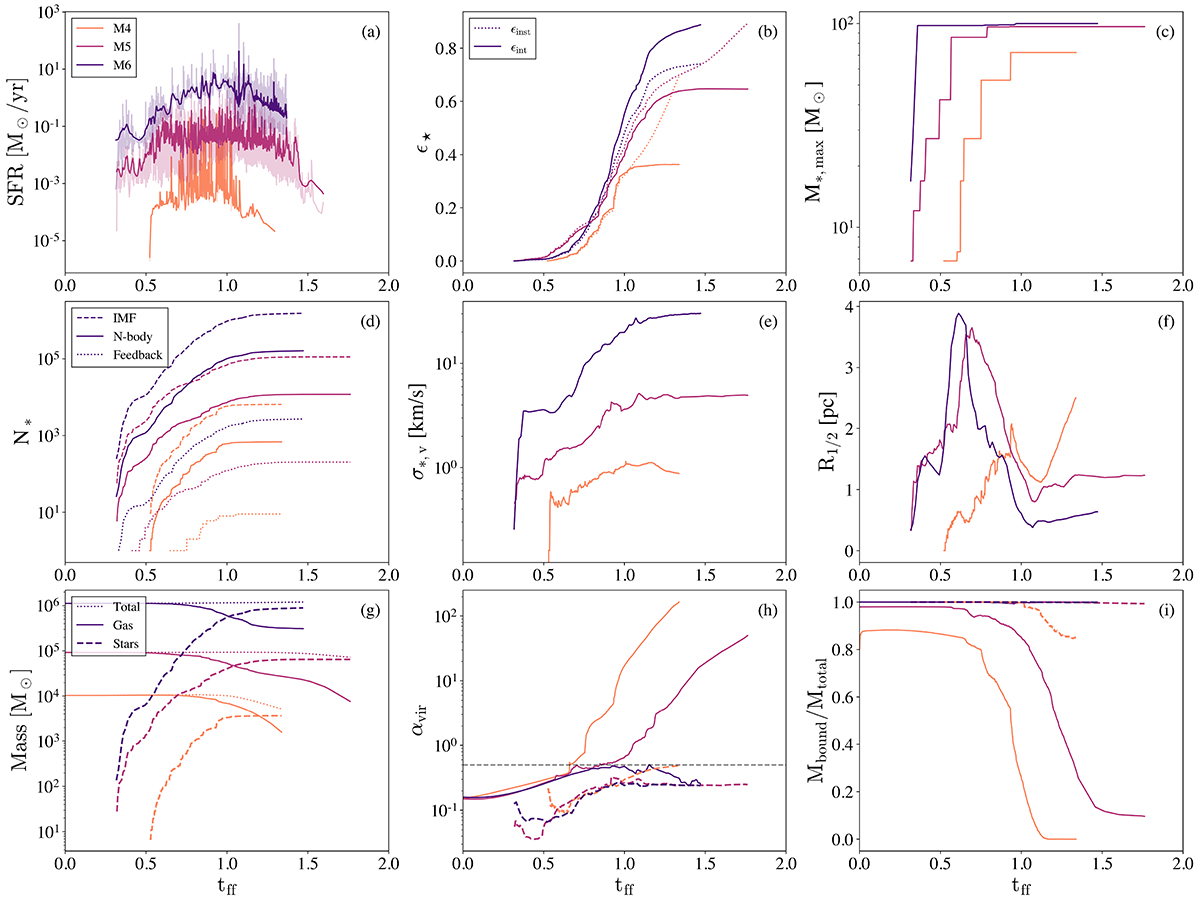
Fig. 4.
Download original image
Global properties of the clusters and gas over time for models M4 (orange), M5 (maroon), and M6 (blue-violet) in units of free-fall time tff of the initial cloud (given in Table 1). From top left to bottom right: (a) SFR, where the transparent lines show the SFR at each star formation event, and the solid lines give the SFR smoothed using a Gaussian filter with σ = 0.005tff. (b) Instantaneous and integrated SFEs of the clouds, where ϵinst = M⋆/(Mgas + Msink + M⋆) and ϵint = M⋆/Mcloud = ϵ⋆. (c) Most massive star formed. (d) Number of formed stars. Dashed line: actual number of stars that would form from sampling the IMF given the amount of gas mass collected for star formation by sink particles. Solid line: number of stars followed in TORCH after the sampled stellar population below 4 M⊙ has been agglomerated. Dotted line: number of stars above 20 M⊙ on the grid that are generating feedback. The number of stars can drop due to SN, mass loss, or exiting the grid. (e) 3D stellar velocity dispersion. (f) Half-mass radius of the entire star cluster. (g) Total mass (dotted line), mass of stars (dashed line) and gas (solid line) on the grid. (h) Virial parameter of stars (dashed line) and gas (solid line), where αv = 0.5 is the equilibrium value. (i) Fraction of mass bound for stars (dashed line) and gas (solid line).
Current usage metrics show cumulative count of Article Views (full-text article views including HTML views, PDF and ePub downloads, according to the available data) and Abstracts Views on Vision4Press platform.
Data correspond to usage on the plateform after 2015. The current usage metrics is available 48-96 hours after online publication and is updated daily on week days.
Initial download of the metrics may take a while.