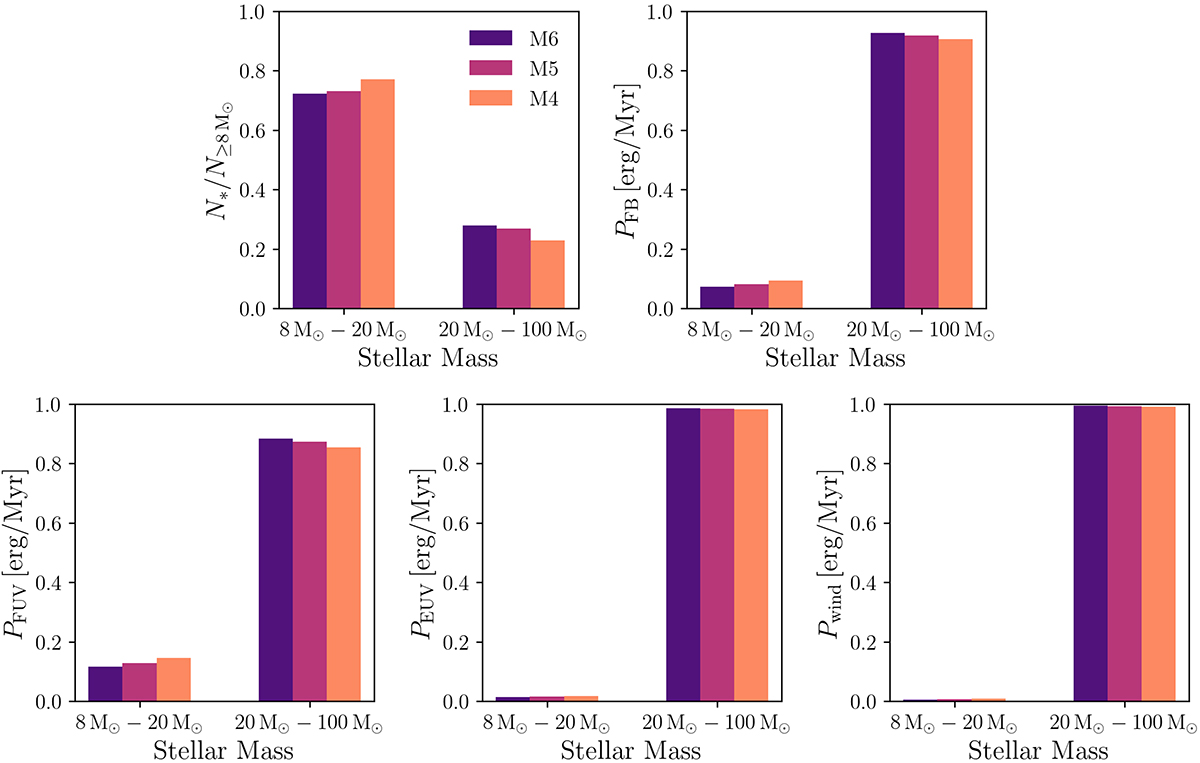
Fig. B.3.
Download original image
Power output of stellar feedback modes for each stellar mass regime. (Top left): Histogram showing the fractional stellar population of the three runs at one free-fall time, split into the mass regimes of 8–20 and 20–100 M⊙. (Top right): Fraction of feedback power in each mass regime. (Bottom): Histograms showing the fraction of feedback power for FUV, EUV, and winds in each mass regime. Although there are more lower-mass stars, the feedback produced by them is less than 20% of the total feedback energy for all stars.
Current usage metrics show cumulative count of Article Views (full-text article views including HTML views, PDF and ePub downloads, according to the available data) and Abstracts Views on Vision4Press platform.
Data correspond to usage on the plateform after 2015. The current usage metrics is available 48-96 hours after online publication and is updated daily on week days.
Initial download of the metrics may take a while.