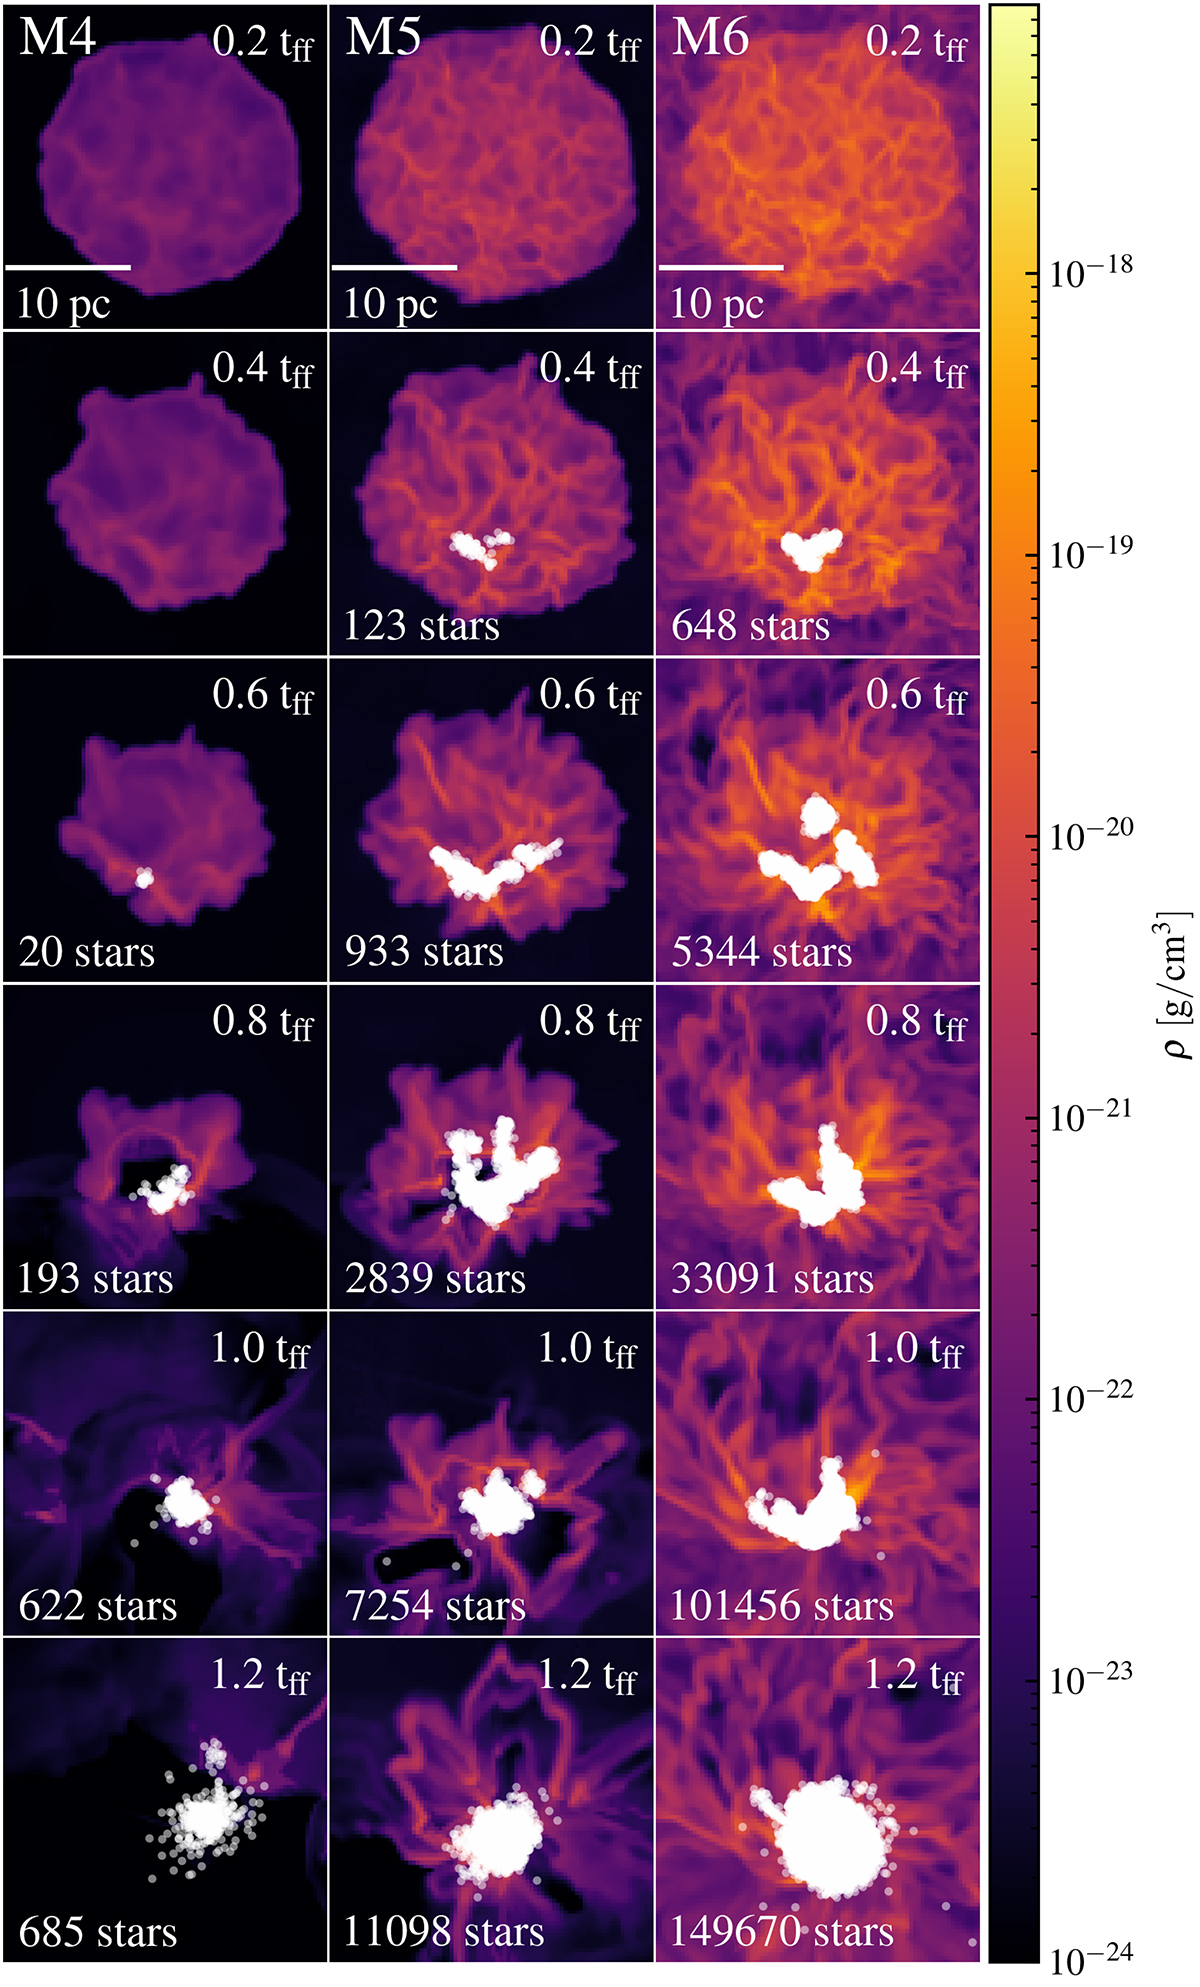
Fig. 1.
Download original image
Slice plots of the three simulations in the x–y plane over time. The plane of the slices for a given cloud is the center of stellar mass in the final snapshot. Stellar positions are shown by white dots. The free-fall times tff are given in Table 1. The number of stars shows the amount of star particles in the domain, not the number sampled from the IMF. Due to our agglomeration of low-mass star particles, the number of stars sampled from the IMF is ∼10× greater.
Current usage metrics show cumulative count of Article Views (full-text article views including HTML views, PDF and ePub downloads, according to the available data) and Abstracts Views on Vision4Press platform.
Data correspond to usage on the plateform after 2015. The current usage metrics is available 48-96 hours after online publication and is updated daily on week days.
Initial download of the metrics may take a while.