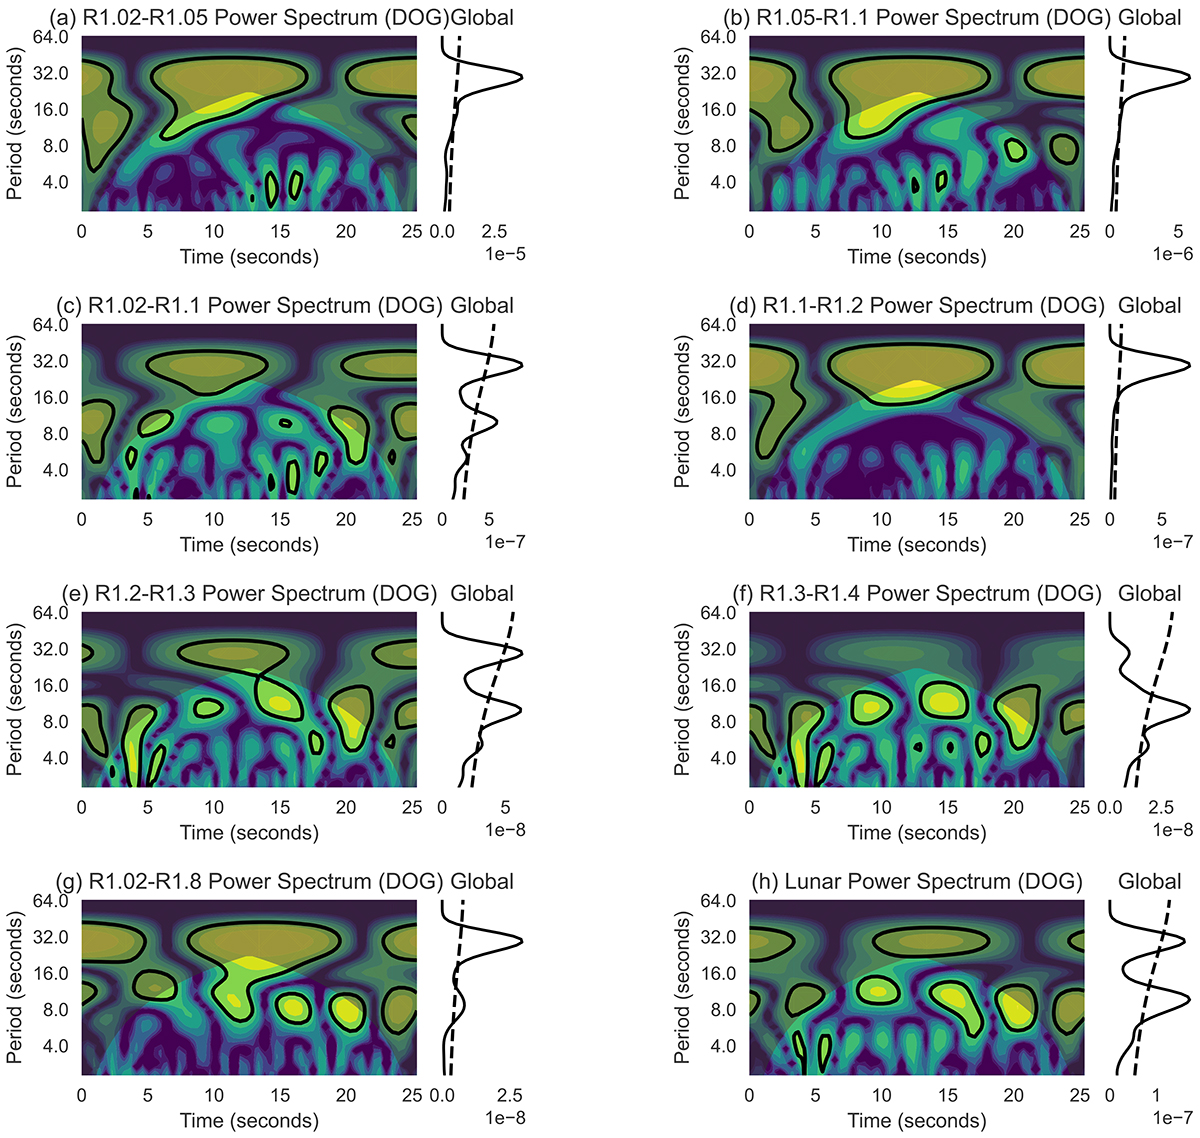
Fig. 6.
Download original image
Wavelet analysis of high-frequency signals along the coronal height. The figure comprises several panels illustrating the wavelet analysis of intensity fluctuations across different segments of the coronal height. Each panel represents a distinct region and the corresponding range of intensity fluctuations. Panel (a) presents wavelet analysis of the intensity form R1.02 to 1.05, the range of the intensity fluctuation in 5 × 10⁻³. Panel (b) covers the range R1.05 to R1.1, where the intensity fluctuation is measured at 2 × 10⁻³. Panel (c) encompasses a broader range, from R1.02 to R1.1, with a fluctuation scope of 1.6 × 10⁻³. Panel (d) extends from R1.1 to R1.2, detailing intensity fluctuations of 6 × 10⁻⁴. Panel (e) spans from R1.2 to R1.3, where intensity fluctuations are observed at 5 × 10⁻⁴. Panel (f) illustrates the region from R1.3 to R1.4, recording intensity fluctuations of 4 × 10⁻⁴. Panel (g) demonstrates a larger range from R1.02 to R1.8, with a noted intensity fluctuation of 2 × 10⁻⁴. Panel (h) presents the wavelet analysis against a lunar background, indicating intensity fluctuations of 8 × 10⁻⁴.
Current usage metrics show cumulative count of Article Views (full-text article views including HTML views, PDF and ePub downloads, according to the available data) and Abstracts Views on Vision4Press platform.
Data correspond to usage on the plateform after 2015. The current usage metrics is available 48-96 hours after online publication and is updated daily on week days.
Initial download of the metrics may take a while.