Open Access
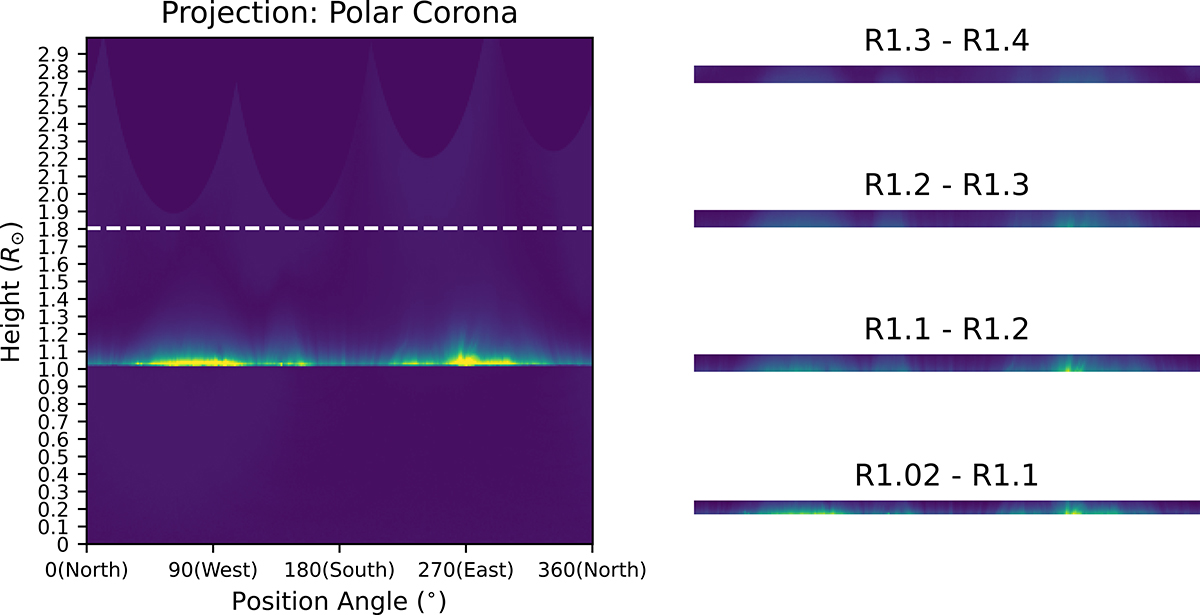
Fig. 5.
Download original image
Coronal features in polar form during the August 21, 2017 TSE. Left panel: Coronal intensity along the position angle and the coronal height. Right panel: Layered images as indicated by the corresponding labels.
Current usage metrics show cumulative count of Article Views (full-text article views including HTML views, PDF and ePub downloads, according to the available data) and Abstracts Views on Vision4Press platform.
Data correspond to usage on the plateform after 2015. The current usage metrics is available 48-96 hours after online publication and is updated daily on week days.
Initial download of the metrics may take a while.