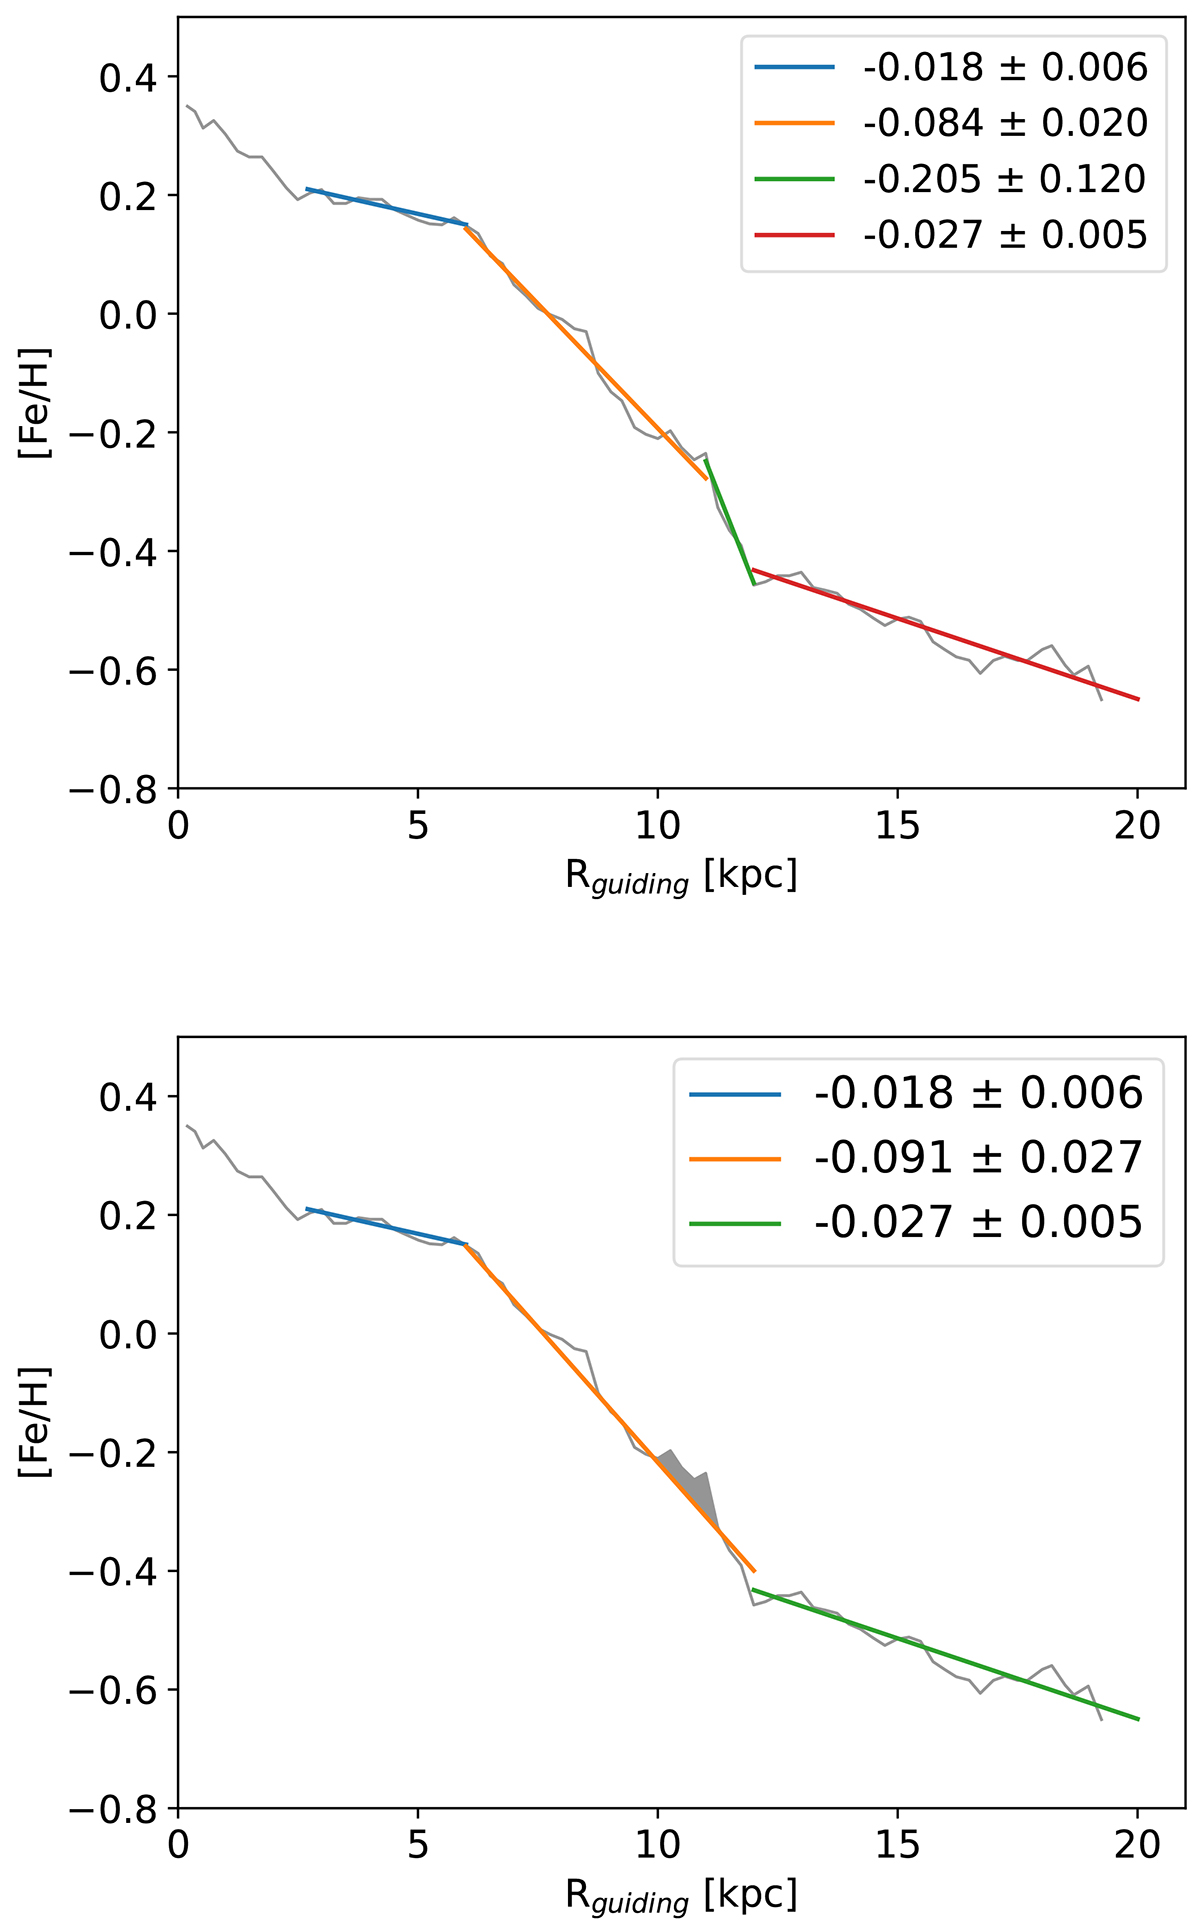
Fig. 6.
Download original image
Fits to radial metallicity profiles of the low-α population in different Galactocentric intervals. Measured gradients are given on each plot. On the bottom plot, the fit between 6 and 11 kpc is prolonged to 12 kpc. The grey area emphasizes the bump in the metallicity profile due to the accumulation of metal-rich stars up to the OLR.
Current usage metrics show cumulative count of Article Views (full-text article views including HTML views, PDF and ePub downloads, according to the available data) and Abstracts Views on Vision4Press platform.
Data correspond to usage on the plateform after 2015. The current usage metrics is available 48-96 hours after online publication and is updated daily on week days.
Initial download of the metrics may take a while.