Fig. 17.
Download original image
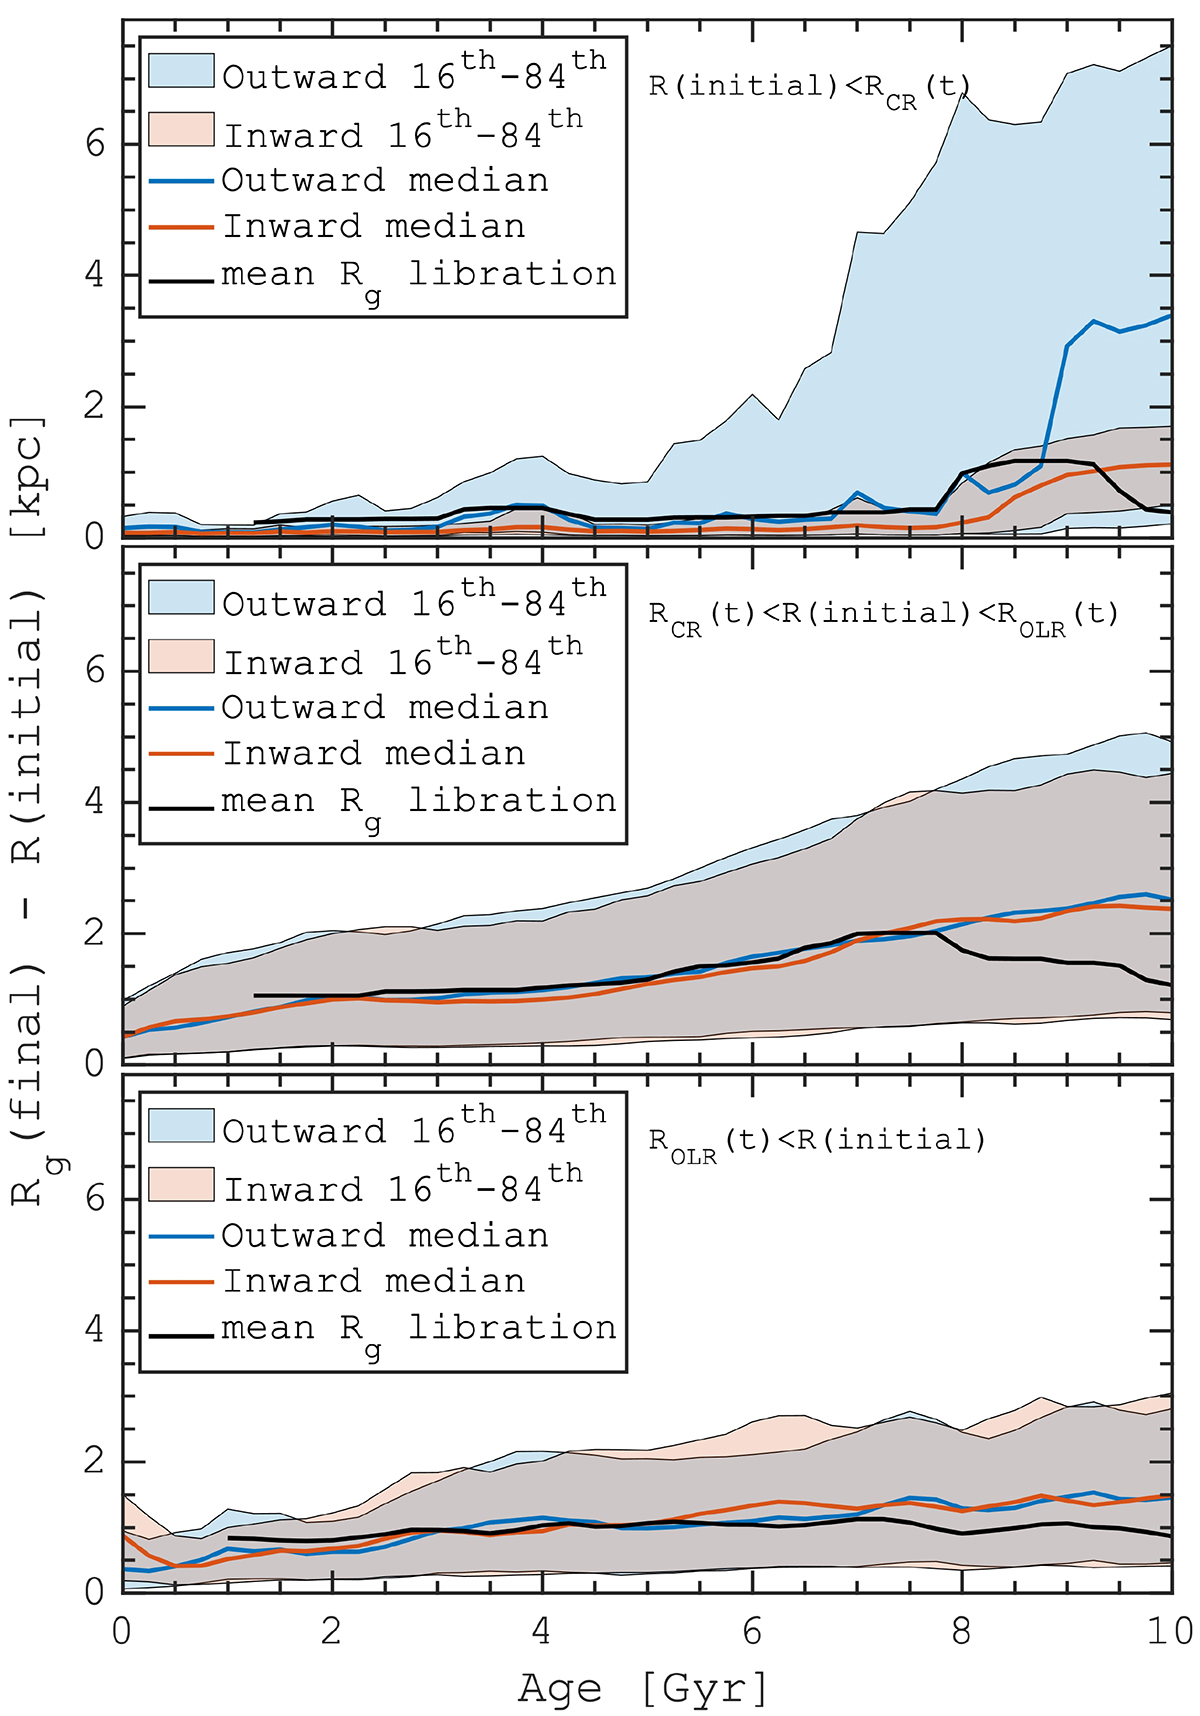
Migration distance, as given by the difference between the final and initial guiding radius for stars with their initial guiding radius inside corotation (top plot), between corotation and OLR (middle), and outside the OLR (bottom plot), divided in an inward (red) and outward motion (blue) (median and 16th and 84th percentile.) The black curves are the mean change in the guiding radius induced by the libration of the orbits.
Current usage metrics show cumulative count of Article Views (full-text article views including HTML views, PDF and ePub downloads, according to the available data) and Abstracts Views on Vision4Press platform.
Data correspond to usage on the plateform after 2015. The current usage metrics is available 48-96 hours after online publication and is updated daily on week days.
Initial download of the metrics may take a while.