Fig. 6.
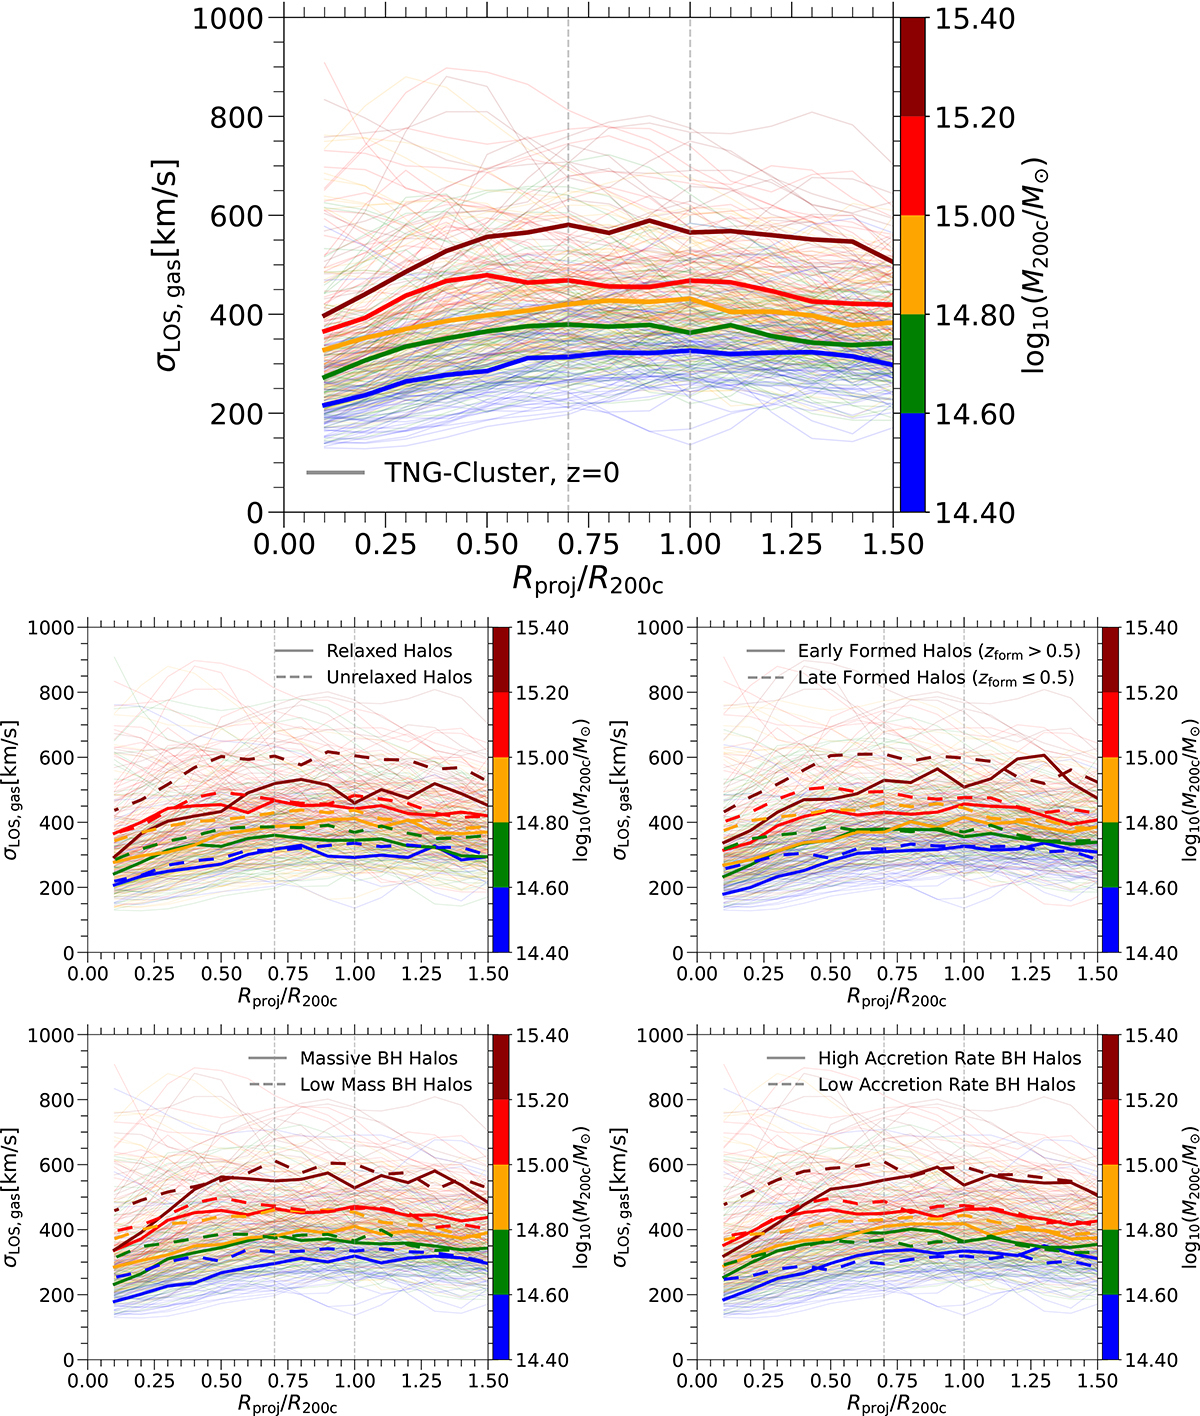
Download original image
Radial profiles of the line-of-sight velocity dispersion for halos. The top panel shows this quantity for all halos, while the other panels show the same quantity for halos classified based on their relaxedness (middle left), and formation time (middle right), SMBH mass (bottom left), SMBH accretion rate (bottom right). Each color corresponds to a different halo mass bin. The thick solid lines depict the mean profile, while the thin lines represent individual clusters. The figure underscores the significant impact of halo properties on the line of sight velocity dispersion.
Current usage metrics show cumulative count of Article Views (full-text article views including HTML views, PDF and ePub downloads, according to the available data) and Abstracts Views on Vision4Press platform.
Data correspond to usage on the plateform after 2015. The current usage metrics is available 48-96 hours after online publication and is updated daily on week days.
Initial download of the metrics may take a while.