Fig. 2.
Download original image
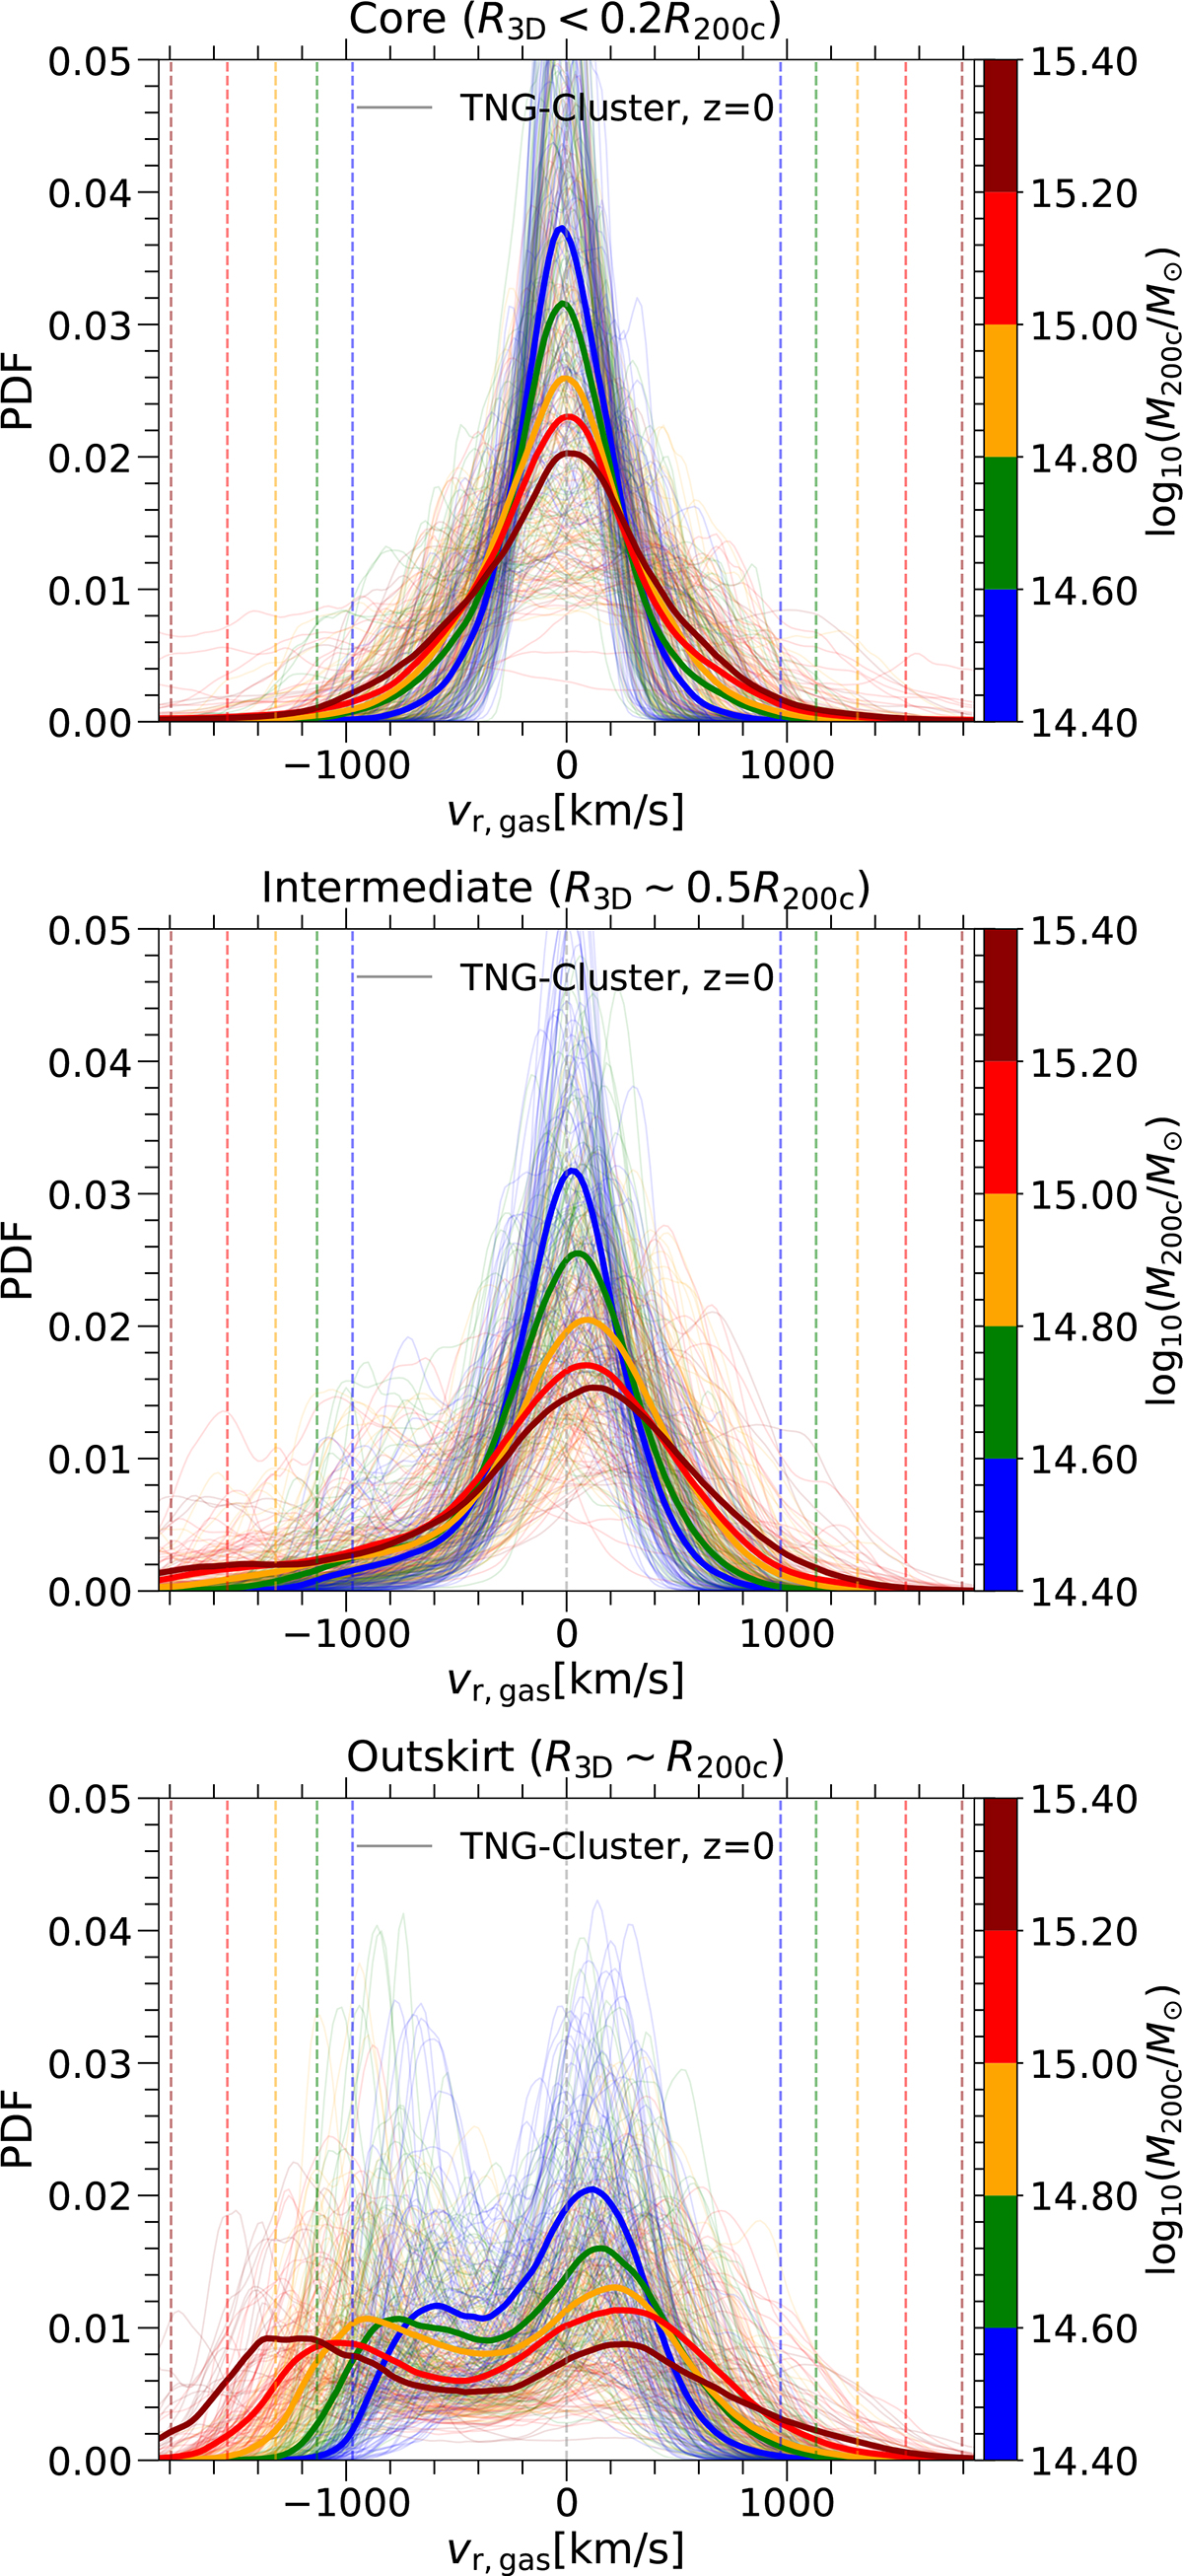
Normalized distributions of gas radial velocities in three different regions of TNG-Cluster halos at z = 0. The top, middle, and bottom panels represent the cluster cores, intermediate regions, and outskirts, respectively. Each color corresponds to a different halo mass bin. The thick solid lines depict the mean profile, while the thin lines represent individual clusters. The colored dashed vertical lines indicate the virial velocity for each mass bin. The gas radial velocity distribution exhibits both inflows and outflows. It is symmetric and follows a Gaussian distribution in the core but becomes asymmetric in the outskirts, featuring a clear second peak at negative velocities.
Current usage metrics show cumulative count of Article Views (full-text article views including HTML views, PDF and ePub downloads, according to the available data) and Abstracts Views on Vision4Press platform.
Data correspond to usage on the plateform after 2015. The current usage metrics is available 48-96 hours after online publication and is updated daily on week days.
Initial download of the metrics may take a while.