Fig. C.1.
Download original image
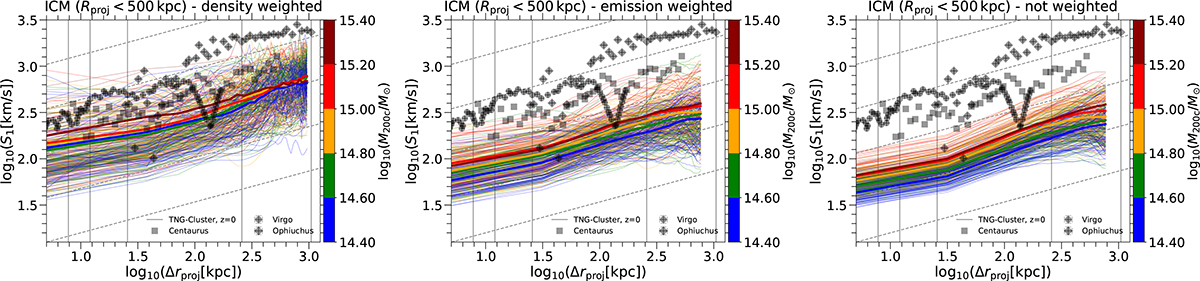
Velocity structure function as a function of the projected separation distance. The three panels correspond to the VSF with different weighting schemes: density-weighted (left), bolometric luminosity weighted (middle), and no-weighting (right). The colors represent different halo mass bins. The thick solid lines depict the mean VSF, while the thin lines represent individual clusters. The figure underscores the significant impact of the weighting scheme on the VSF.
Current usage metrics show cumulative count of Article Views (full-text article views including HTML views, PDF and ePub downloads, according to the available data) and Abstracts Views on Vision4Press platform.
Data correspond to usage on the plateform after 2015. The current usage metrics is available 48-96 hours after online publication and is updated daily on week days.
Initial download of the metrics may take a while.