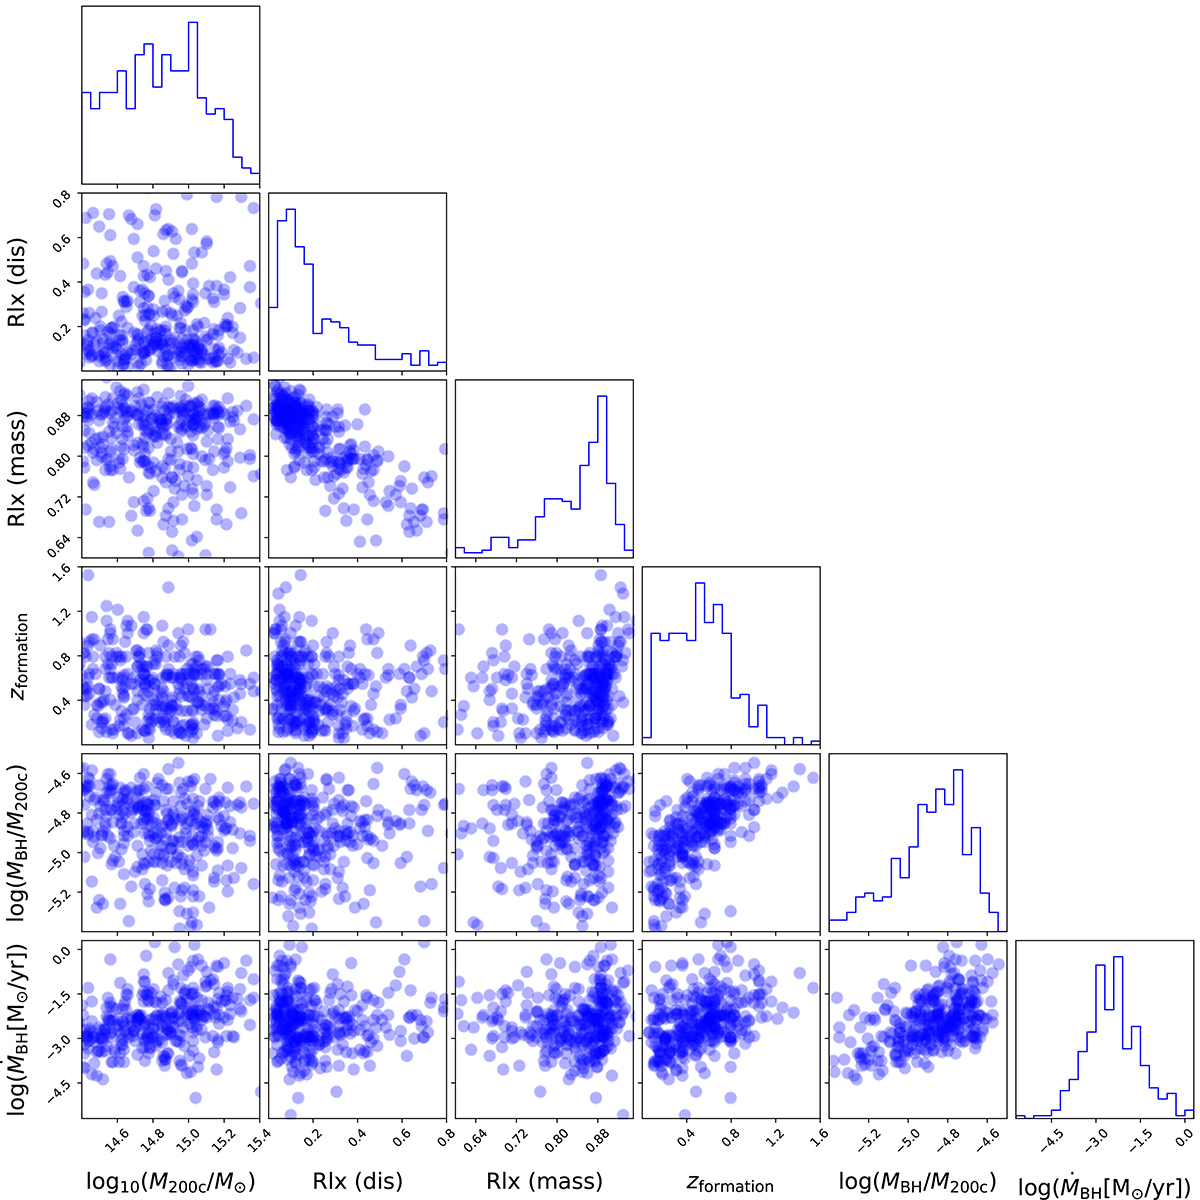
Fig. A.1.
Download original image
Distribution and cross correlation of several halo properties used in this work. Each row/column corresponds to a specific quantity. The rightmost panel of every row displays the probability distribution of that quantity, while the other panels represent the cross correlation between different pairs of quantities. From left to right: halo mass (M200c), relaxedness parameter based on distance, relaxedness parameter based on mass, formation redshift, SMBH mass, and SMBH accretion rate. Each dot corresponds to an individual galaxy cluster.
Current usage metrics show cumulative count of Article Views (full-text article views including HTML views, PDF and ePub downloads, according to the available data) and Abstracts Views on Vision4Press platform.
Data correspond to usage on the plateform after 2015. The current usage metrics is available 48-96 hours after online publication and is updated daily on week days.
Initial download of the metrics may take a while.