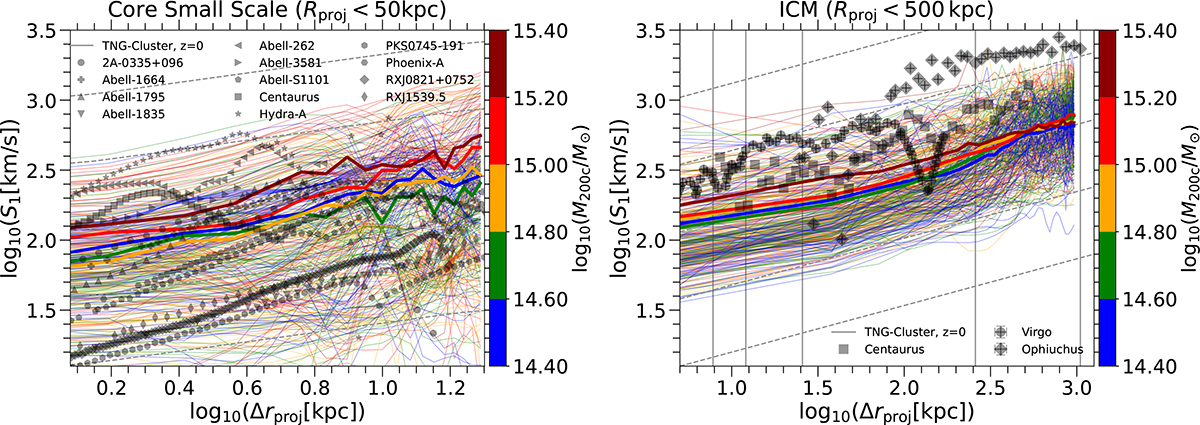
Fig. 14.
Download original image
Comparison of the velocity structure function from the full sample of the TNG-Cluster simulation at z = 0 with available observational data. The left panel compares simulated VSFs with observations of cold gas in the cores of galaxy clusters (Li et al. 2020; Ganguly et al. 2023). The right panel contrasts the simulated VSF with inferences from X-ray observations of the hot ICM (Gatuzz et al. 2023). In both cases, the VSF is density weighted (see text). In the right panel, the vertical errorbars, shown for only a few data points as representative of the whole sample, are of order of 1000 km/s. These correspond to large observational uncertainties, as discussed in the text. Overall, we find that there are, within the population of our simulated clusters, examples that broadly reproduce the behavior of the observed VSFs. The possible exception is the large scale measurements for Ophiuchus, where only a rough qualitative agreement exists given the observational uncertainties. At the same time, there is significant cluster-to-cluster variability of the VSF, indicating the complex physics governing the most massive objects in the Universe.
Current usage metrics show cumulative count of Article Views (full-text article views including HTML views, PDF and ePub downloads, according to the available data) and Abstracts Views on Vision4Press platform.
Data correspond to usage on the plateform after 2015. The current usage metrics is available 48-96 hours after online publication and is updated daily on week days.
Initial download of the metrics may take a while.