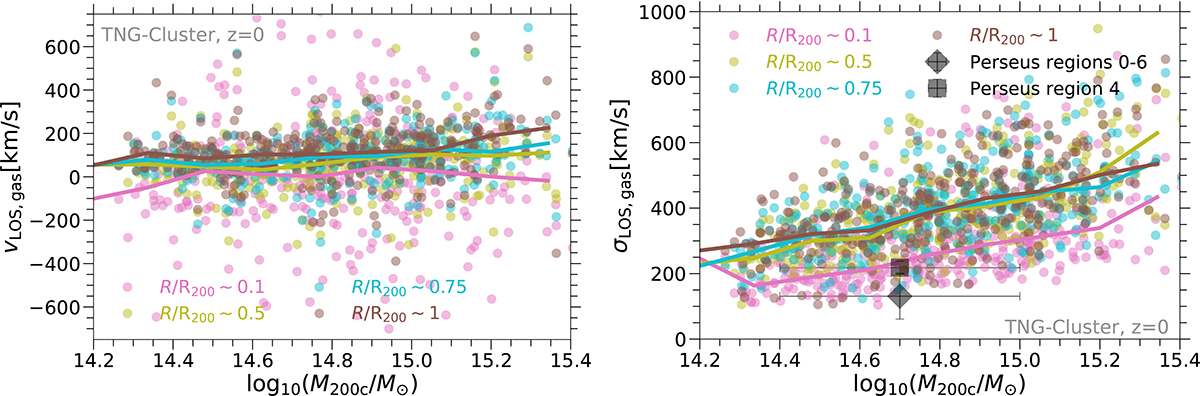
Fig. 12.
Download original image
Observable kinematics of TNG-Cluster halos: line-of-sight velocity (left) and velocity dispersion (right) as a function of the halo mass. Each dot corresponds to a halo, with the color representing the halocentric distance at which the velocity is measured. Lines show running medians. The big square and big diamond correspond to the Hitomi measurements of the velocity dispersion of the core of the Perseus cluster (Hitomi Collaboration 2018). Velocity dispersion increases rapidly for more massive halos, while the annular averaged line of sight velocities remain near zero on average, as expected. At the same time, there is significant diversity i.e., large scatter across the sample.
Current usage metrics show cumulative count of Article Views (full-text article views including HTML views, PDF and ePub downloads, according to the available data) and Abstracts Views on Vision4Press platform.
Data correspond to usage on the plateform after 2015. The current usage metrics is available 48-96 hours after online publication and is updated daily on week days.
Initial download of the metrics may take a while.