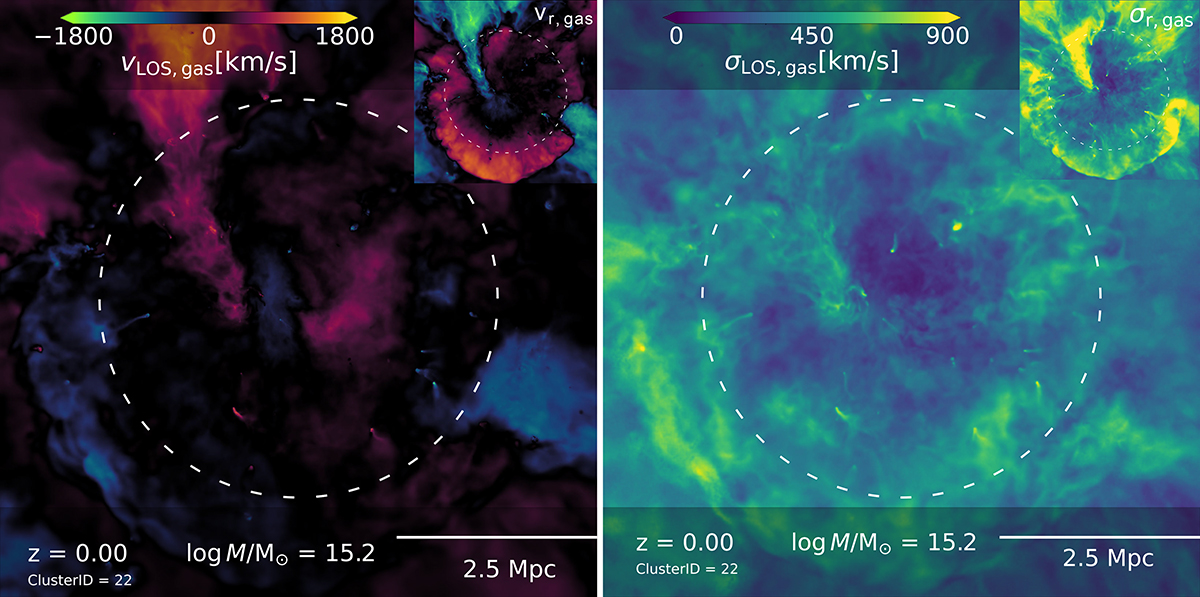
Fig. 10.
Download original image
Maps of observable kinematics for the same halo as in Fig. 1. The left panel shows line of sight velocity, while the right panel shows line of sight velocity dispersion. Both are weighted by X-ray luminosity, such that they preferentially trace the flows of hot gas, as would be characterized by X-ray observations. The halo R200c is indicated by the white circles. For comparison, the 3D radial velocity and velocity dispersion from Fig. 1 are shown in the top right corner of each panel.
Current usage metrics show cumulative count of Article Views (full-text article views including HTML views, PDF and ePub downloads, according to the available data) and Abstracts Views on Vision4Press platform.
Data correspond to usage on the plateform after 2015. The current usage metrics is available 48-96 hours after online publication and is updated daily on week days.
Initial download of the metrics may take a while.