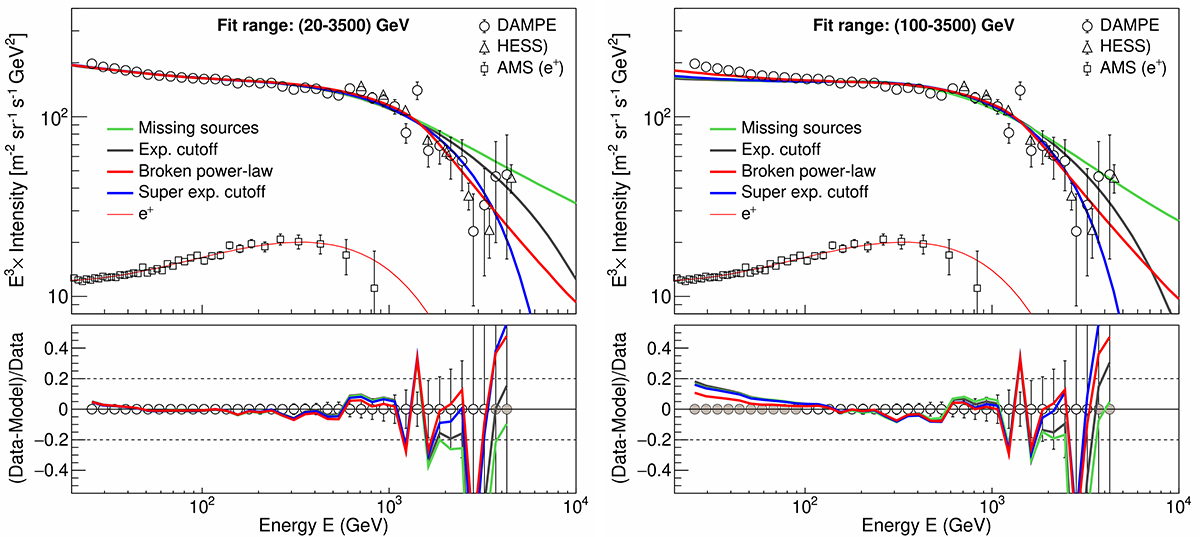
Fig. 2.
Download original image
Comparison of the best-fit electron plus positron spectra of the different scenarios for the two different fit ranges: (20 − 3500) GeV (left) and (100 − 3500) GeV (right). Line representation: missing sources (green line), exponential cutoff (black line), broken power-law (thick red line), and super-exponential cutoff (blue line). For the (20 − 3500) GeV fit, the best-fit electron plus positron spectra are the same as shown in Fig. 1. The top plots show the spectral fits, and the bottom plots show the fit residuals. Residuals are shown only with respect to the DAMPE data, but the χ2 calculation includes both the DAMPE and the H.E.S.S. data. Filled circles in the residual plots represent data points not included in the fit. The dashed lines represent ±20% residual levels, shown only for reference. The best-fit values of the model parameters and the χ2 values are listed in Table 2. All of the data shown and the positron spectrum (thin red line) are the same as in Fig. 1.
Current usage metrics show cumulative count of Article Views (full-text article views including HTML views, PDF and ePub downloads, according to the available data) and Abstracts Views on Vision4Press platform.
Data correspond to usage on the plateform after 2015. The current usage metrics is available 48-96 hours after online publication and is updated daily on week days.
Initial download of the metrics may take a while.