Fig. 7.

Download original image
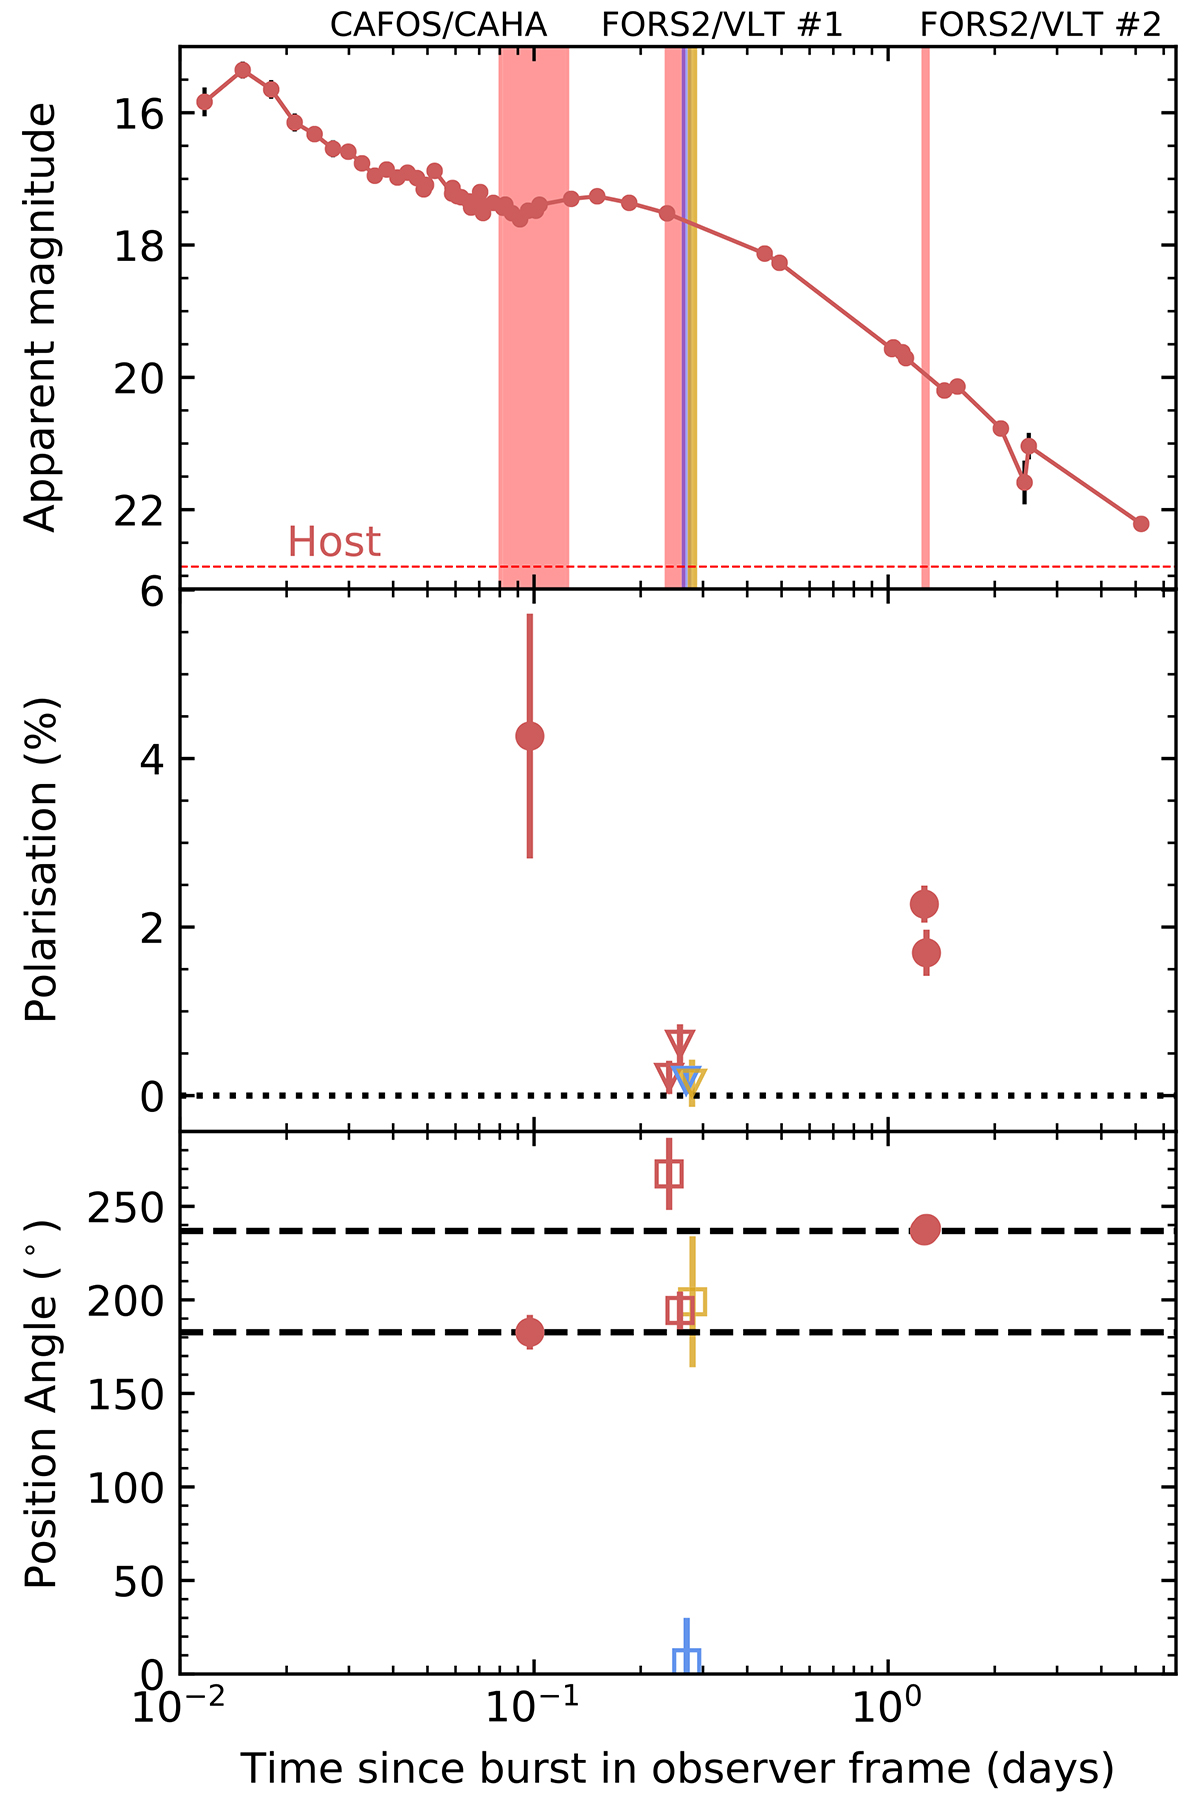
Afterglow, PD and PA evolution of GRB 210610B. Top panel: GRB 210610B light curve for the r band (see Table A.1). We converted the SBT Clear band and R band into r band as indicated in Sects. 2.3.1 and 2.3.2. The vertical stripes from left to right denote the first polarimetry epoch (CAHA/CAFOS) and the second and third epochs (both with VLT/FORS2). The host observations in r band are marked with a dashed red line. Middle panel: Evolution of the linear polarisation of GRB 210610B. The red dots shows the measured polarisation for R band, and blue and orange triangles denote the lower limits in the b and z bands. Bottom panel: Linear polarisation measured PA for GRB 210610B. The detections are marked with filled circles, and the corresponding PAs for the PD limits are marked with empty squares as these values are neither lower nor upper limits. The dashed black lines denote the PA for the first (bottom) and the third (top) epoch.
Current usage metrics show cumulative count of Article Views (full-text article views including HTML views, PDF and ePub downloads, according to the available data) and Abstracts Views on Vision4Press platform.
Data correspond to usage on the plateform after 2015. The current usage metrics is available 48-96 hours after online publication and is updated daily on week days.
Initial download of the metrics may take a while.


