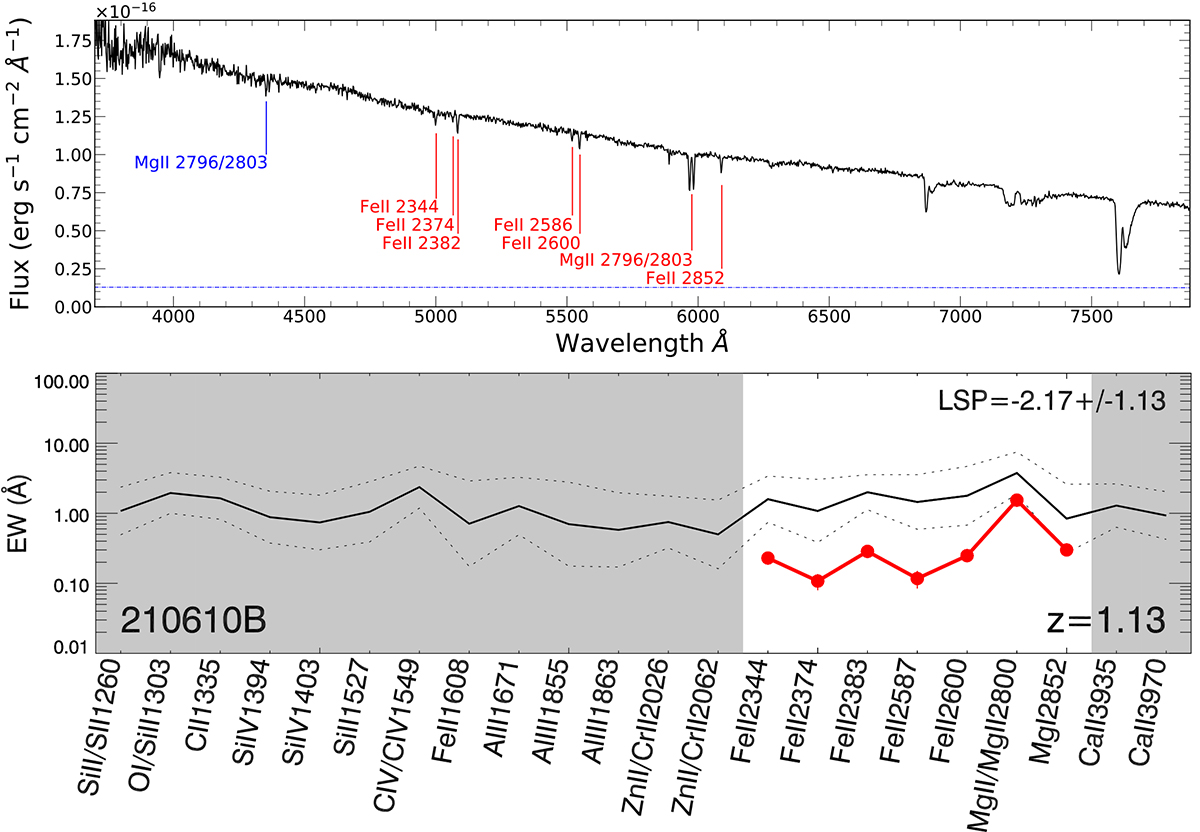
Fig. 4.
Download original image
Absorption spectroscopy and line properties for GRB 210610B. Top: Spectral features detected at the redshift of the GRB, plotted in red, and the features from the intervening system are shown in blue. The dashed blue line shows the error spectrum. Bottom: Line-strength diagram for the spectral features in the host galaxy. The diagram compares the features measured in our spectrum (red) with the average values of a larger sample (black) (see Sect. 3.3).
Current usage metrics show cumulative count of Article Views (full-text article views including HTML views, PDF and ePub downloads, according to the available data) and Abstracts Views on Vision4Press platform.
Data correspond to usage on the plateform after 2015. The current usage metrics is available 48-96 hours after online publication and is updated daily on week days.
Initial download of the metrics may take a while.