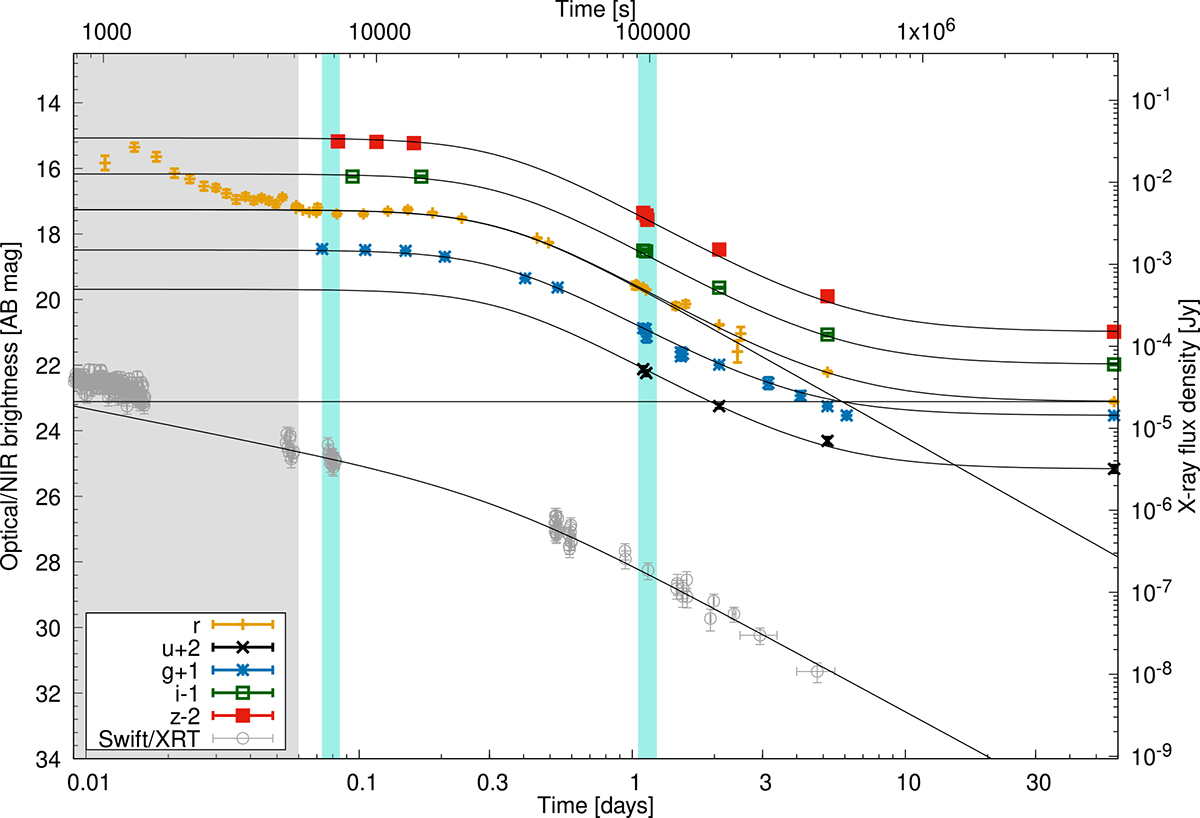
Fig. 3.

Download original image
GRB optical to X-ray light curve fit to available photometry (see Table A.1) and Swift X-ray data. The grey shaded region is not taken into account for the fit as it may be contaminated by the prompt emission. The clear cyan regions mark the times we chose to derive the SED of the light curve. The data are shown with an offset in flux for better visibility.
Current usage metrics show cumulative count of Article Views (full-text article views including HTML views, PDF and ePub downloads, according to the available data) and Abstracts Views on Vision4Press platform.
Data correspond to usage on the plateform after 2015. The current usage metrics is available 48-96 hours after online publication and is updated daily on week days.
Initial download of the metrics may take a while.


