Fig. 9.
Download original image
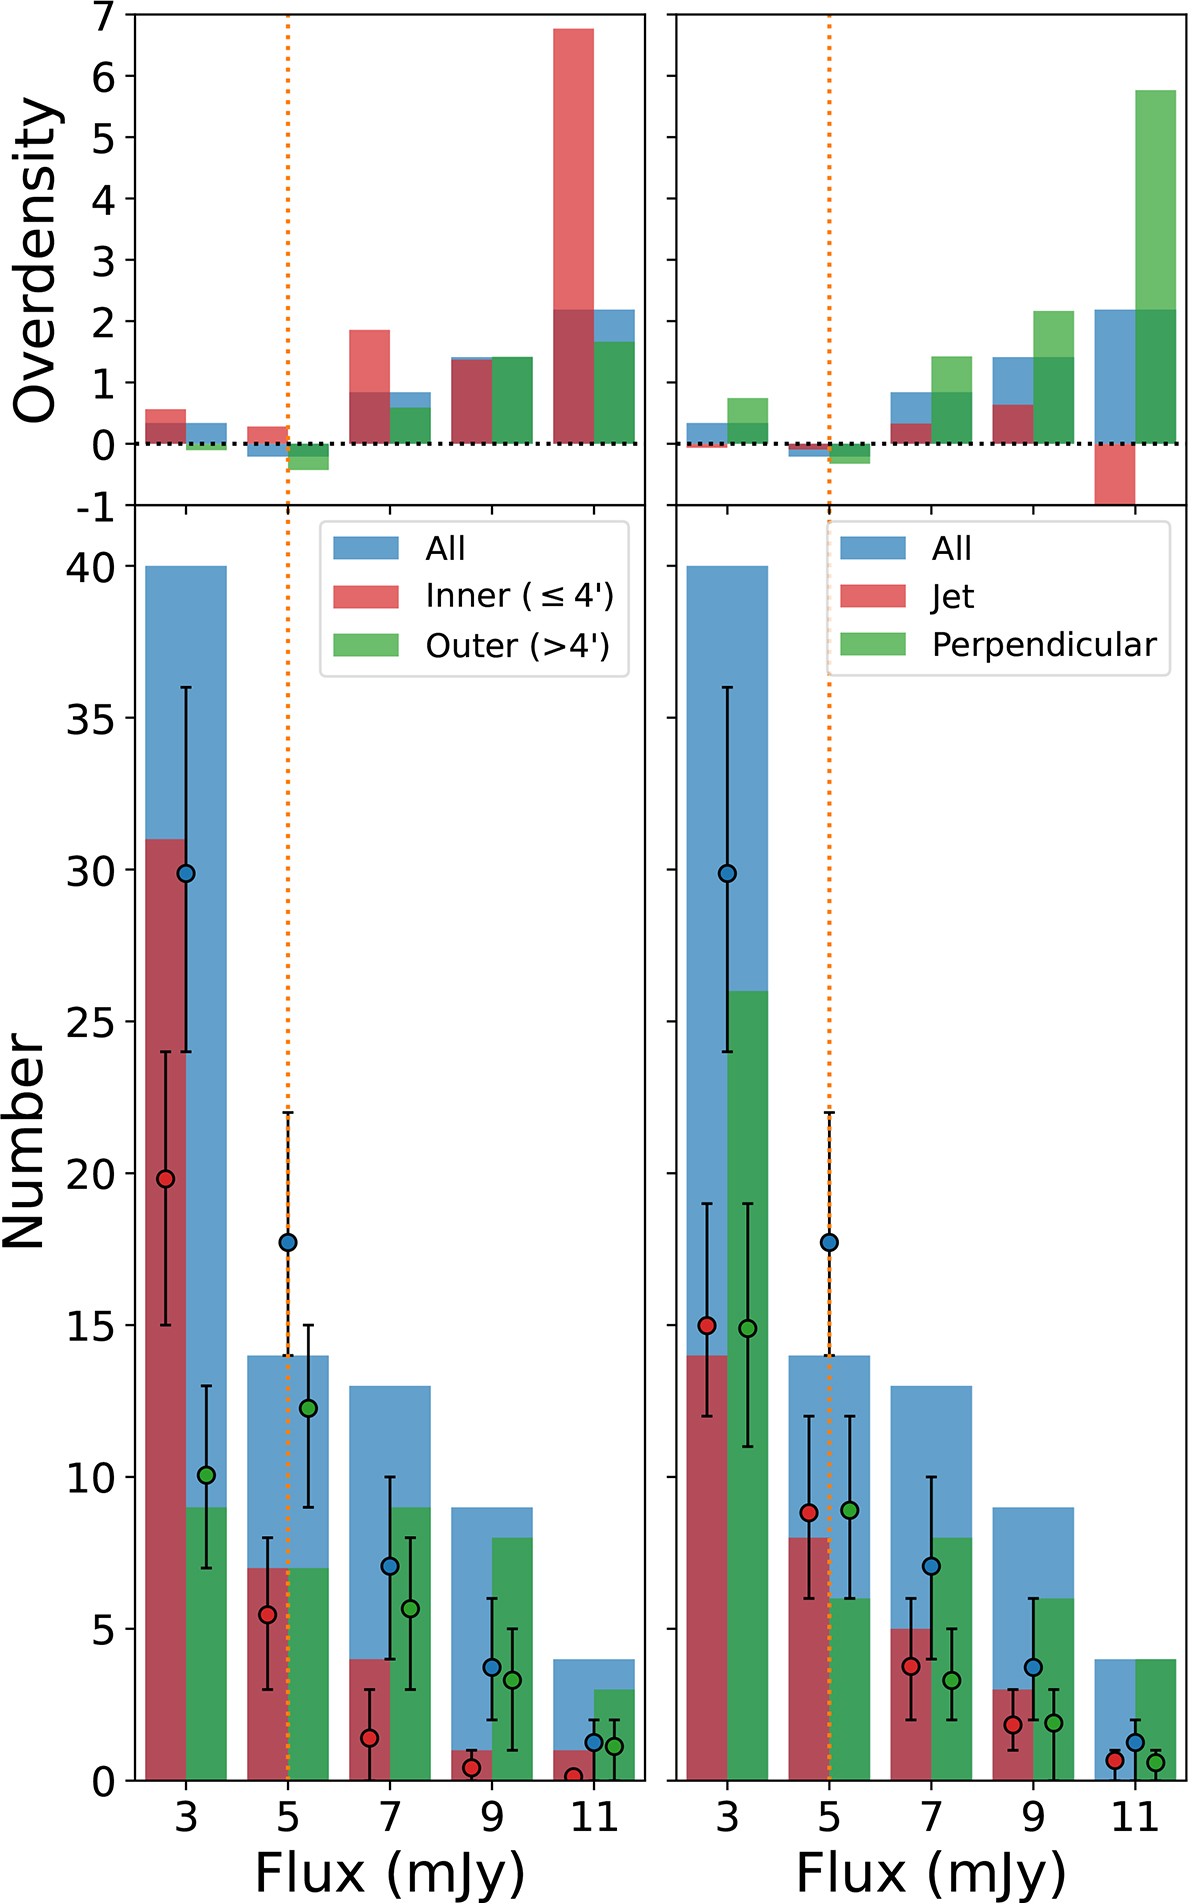
Number distribution of SMGs as a function of the flux density. Points with error bars represent the expected numbers of SMGs from the blank field, while the histograms are the measured numbers in the 4C 23.56 field. The blue histogram illustrates the total number of SMGs within flux bins of 2 mJy. Left: SMG sample divided into the central 4′ from the HzRG (inner; red) and the outer > 4′ (outer; green) regions. Right: SMG sample based on angular distribution: within 45° of the jet direction (red) outside the jet (perpendicular; green). The corresponding overdensities as functions of flux are plotted in the top panel on each plot. The dotted orange line indicates the flux threshold (i.e., 5 mJy) that we used for further analysis. Overdensity increases with the flux density in both inner and outer regions. But neither the overdensity nor this positive correlation exists in the jet region.
Current usage metrics show cumulative count of Article Views (full-text article views including HTML views, PDF and ePub downloads, according to the available data) and Abstracts Views on Vision4Press platform.
Data correspond to usage on the plateform after 2015. The current usage metrics is available 48-96 hours after online publication and is updated daily on week days.
Initial download of the metrics may take a while.