Open Access
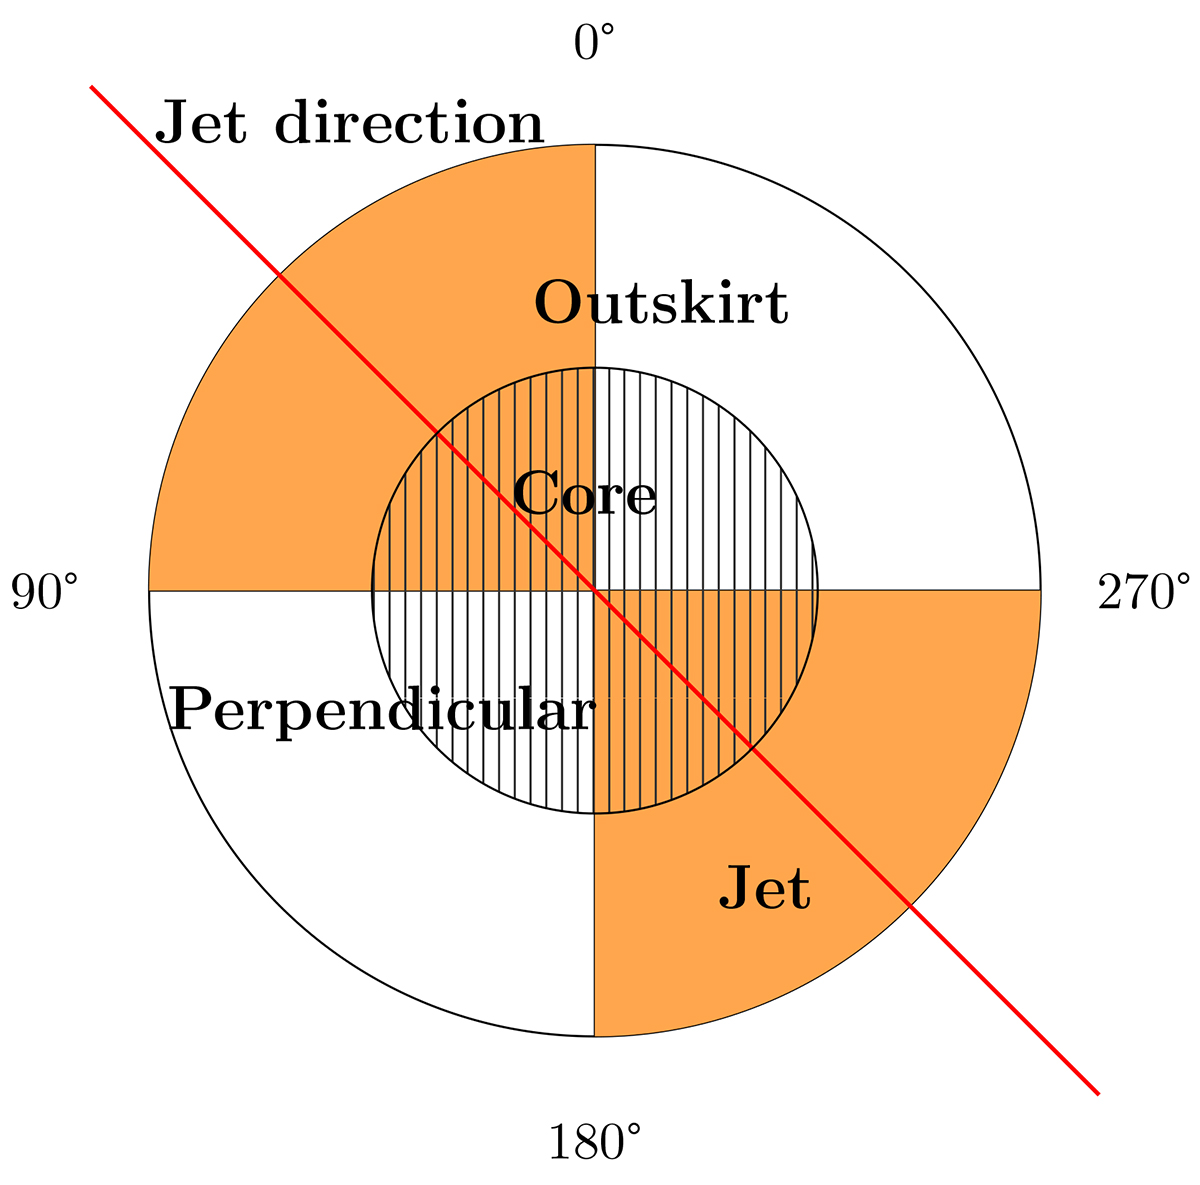
Fig. 7.
Download original image
Illustration of the HzRG environment. We separate the region by the distance to the HzRG and the angle to the radio jet. The regions close to the jet are defined as the jet subsample and the rest as the perpendicular subsample. The position angles are indicated on the diagram.
Current usage metrics show cumulative count of Article Views (full-text article views including HTML views, PDF and ePub downloads, according to the available data) and Abstracts Views on Vision4Press platform.
Data correspond to usage on the plateform after 2015. The current usage metrics is available 48-96 hours after online publication and is updated daily on week days.
Initial download of the metrics may take a while.