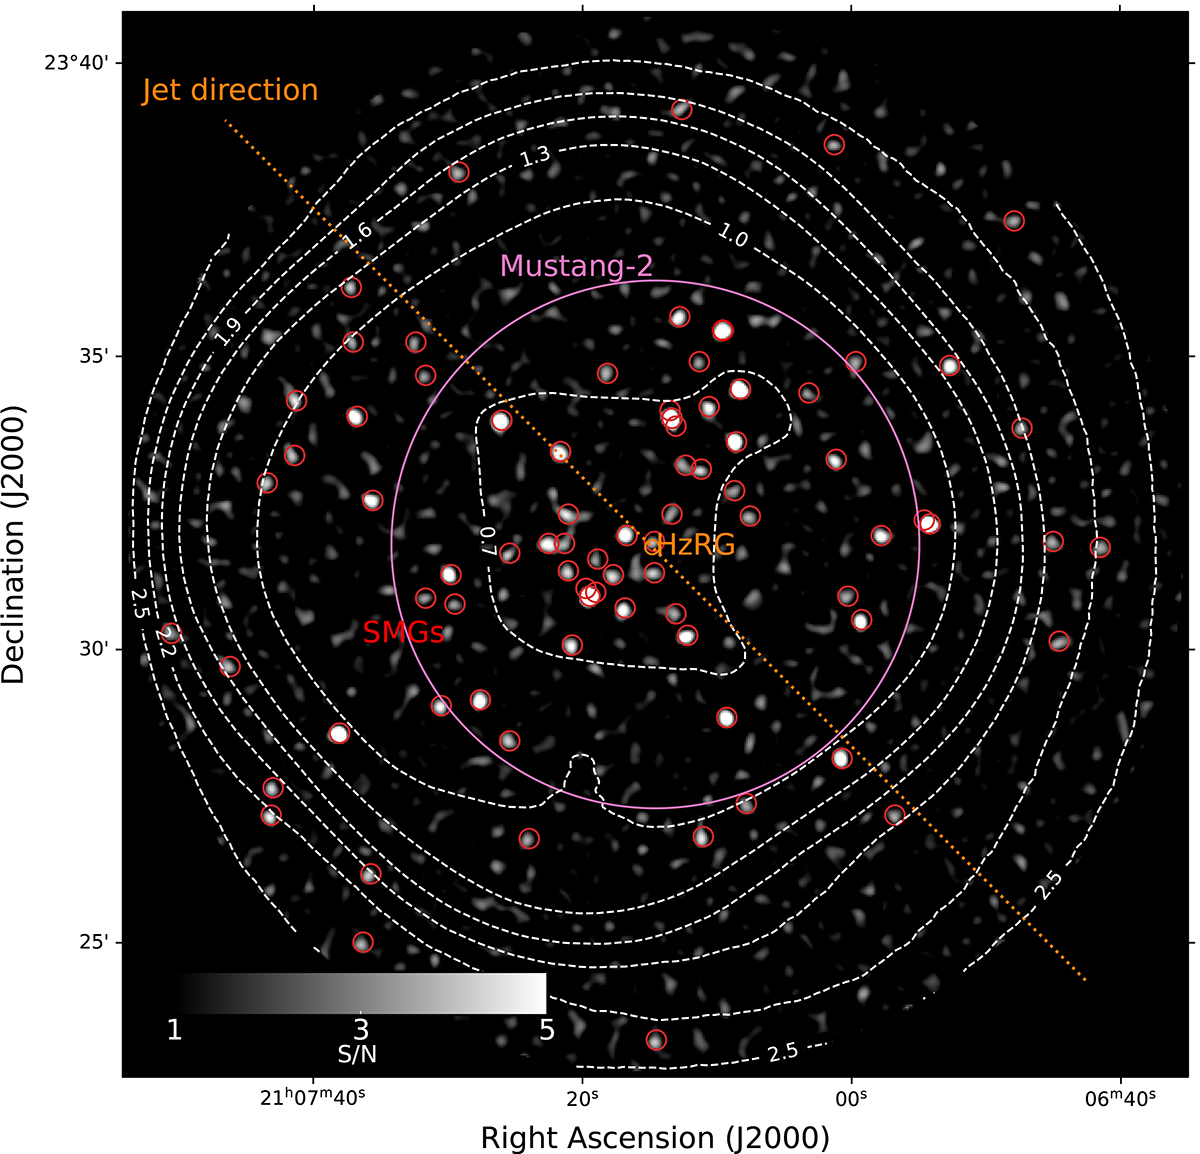
Fig. 3.
Download original image
SCUBA-2 850 μm S/N map of 4C 23.56 (z = 2.48) shown in grayscale. The solid pink contour shows the footprint of MUSTANG-2 observations. The noise contours are indicated as dashed white lines in units of mJy/beam. The HzRG and SMGs are marked as an orange circle and red circles, respectively. The corresponding jet direction (Fig. 1) is shown as a dotted orange line.
Current usage metrics show cumulative count of Article Views (full-text article views including HTML views, PDF and ePub downloads, according to the available data) and Abstracts Views on Vision4Press platform.
Data correspond to usage on the plateform after 2015. The current usage metrics is available 48-96 hours after online publication and is updated daily on week days.
Initial download of the metrics may take a while.