Fig. 15.
Download original image
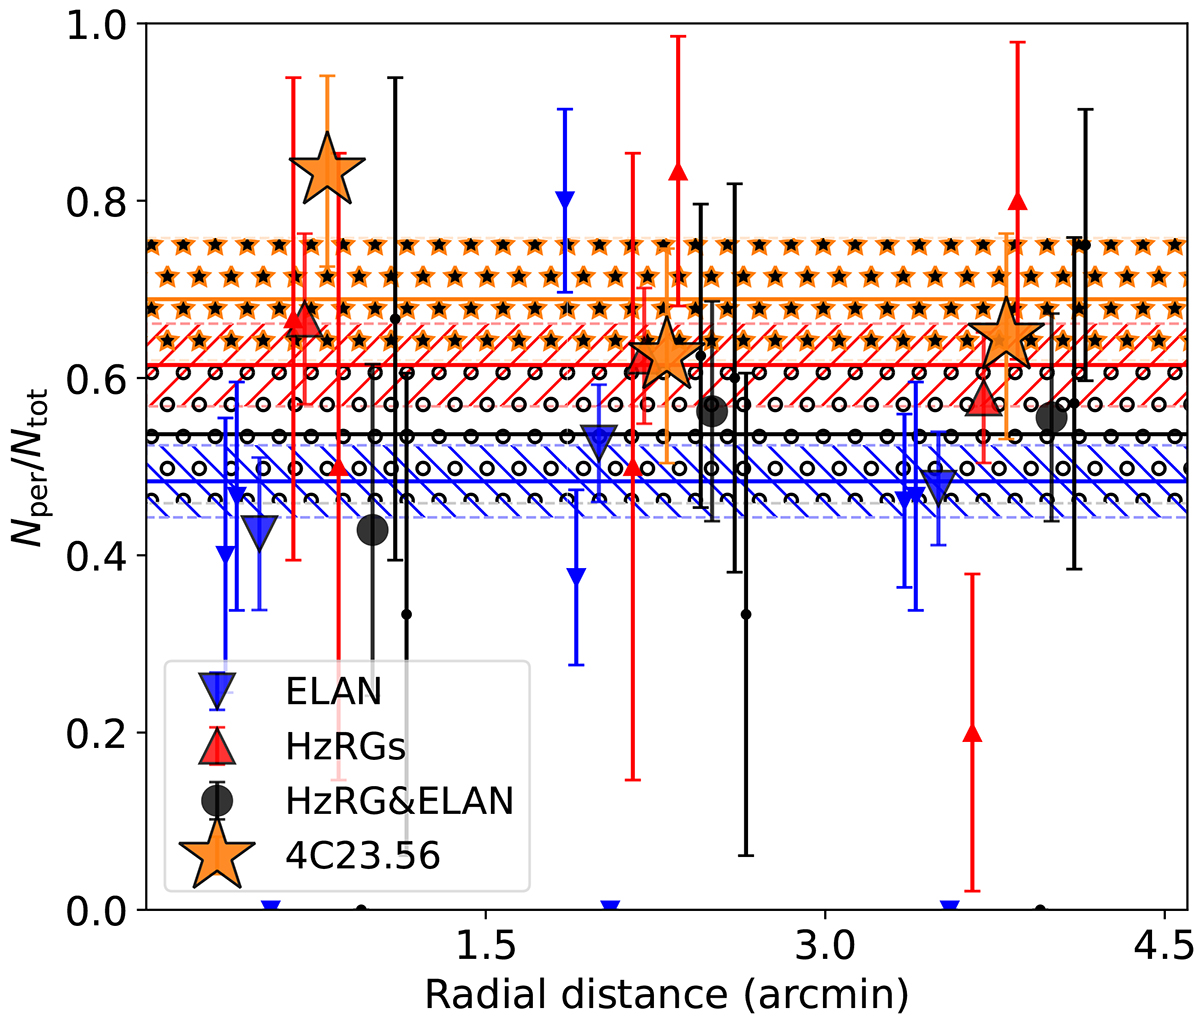
Comparison of the radial variation in the anisotropic level of the SMG distribution. All SMGs are included in this analysis. The small symbols are the values for each individual field. The large symbols are the stacked results for corresponding categories. The horizontal lines and hatches in different colors indicate the average values and the associated Poisson uncertainties of each AGN field. We can see that in the 4C 23.56 field, although SMG fraction is consistent with a homogeneous distribution at r < 1.5′, SMGs show a stronger preference for the perpendicular region than other fields.
Current usage metrics show cumulative count of Article Views (full-text article views including HTML views, PDF and ePub downloads, according to the available data) and Abstracts Views on Vision4Press platform.
Data correspond to usage on the plateform after 2015. The current usage metrics is available 48-96 hours after online publication and is updated daily on week days.
Initial download of the metrics may take a while.