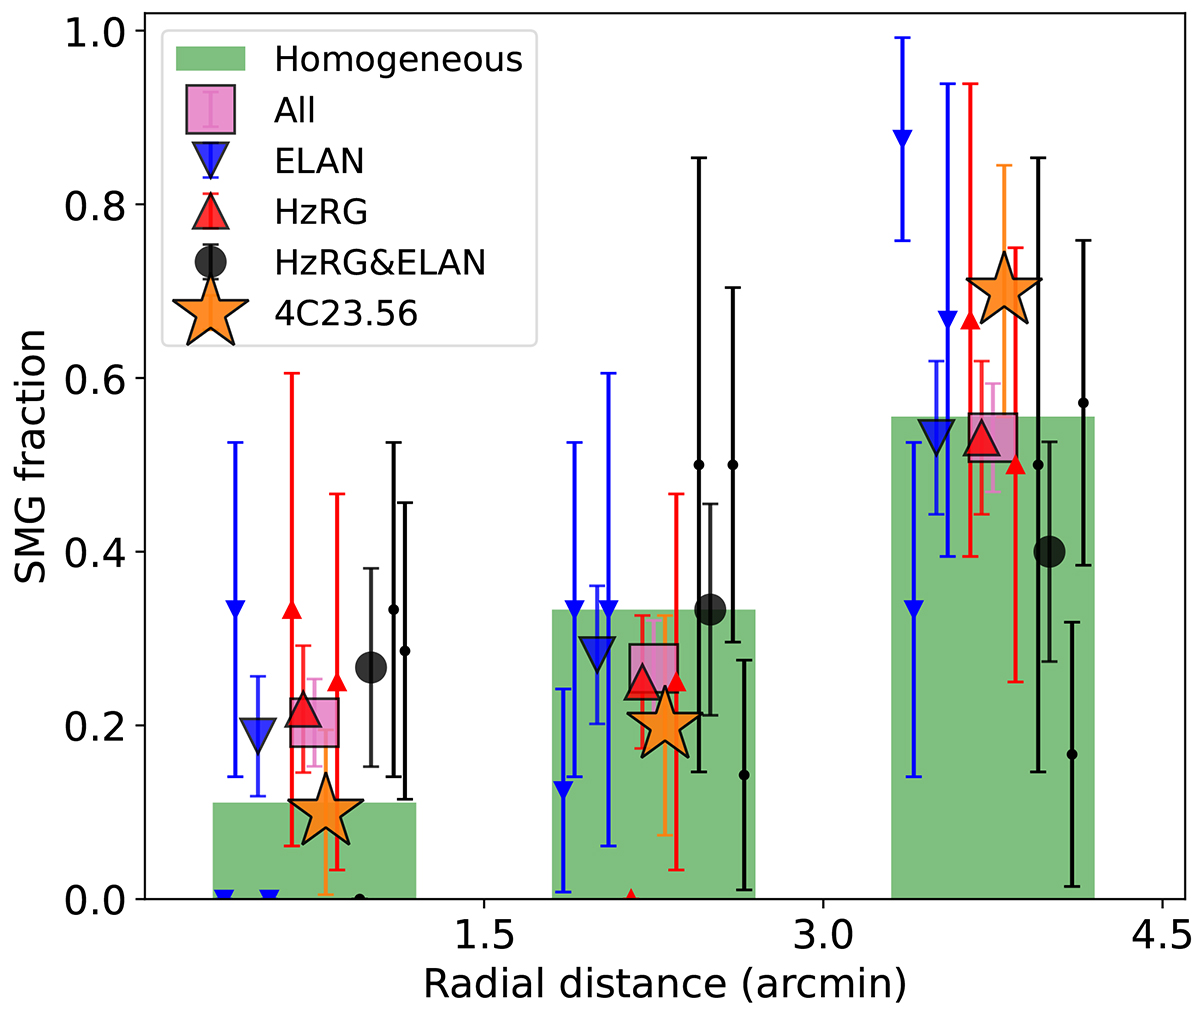
Fig. 14.
Download original image
Comparison of the radial variation in the SMG fraction. The green bar indicates the expected SMG fraction for a homogeneous distribution. The small symbols are the values for each individual field. The large symbols are the stacked results for corresponding types of fields. Poisson noise is assumed as the associated uncertainty. We can see that SMGs are concentrated in the central 1.5′ in general, while more SMGs can be from at 3′≤r < 4.5′ in the 4C 23.56 field.
Current usage metrics show cumulative count of Article Views (full-text article views including HTML views, PDF and ePub downloads, according to the available data) and Abstracts Views on Vision4Press platform.
Data correspond to usage on the plateform after 2015. The current usage metrics is available 48-96 hours after online publication and is updated daily on week days.
Initial download of the metrics may take a while.