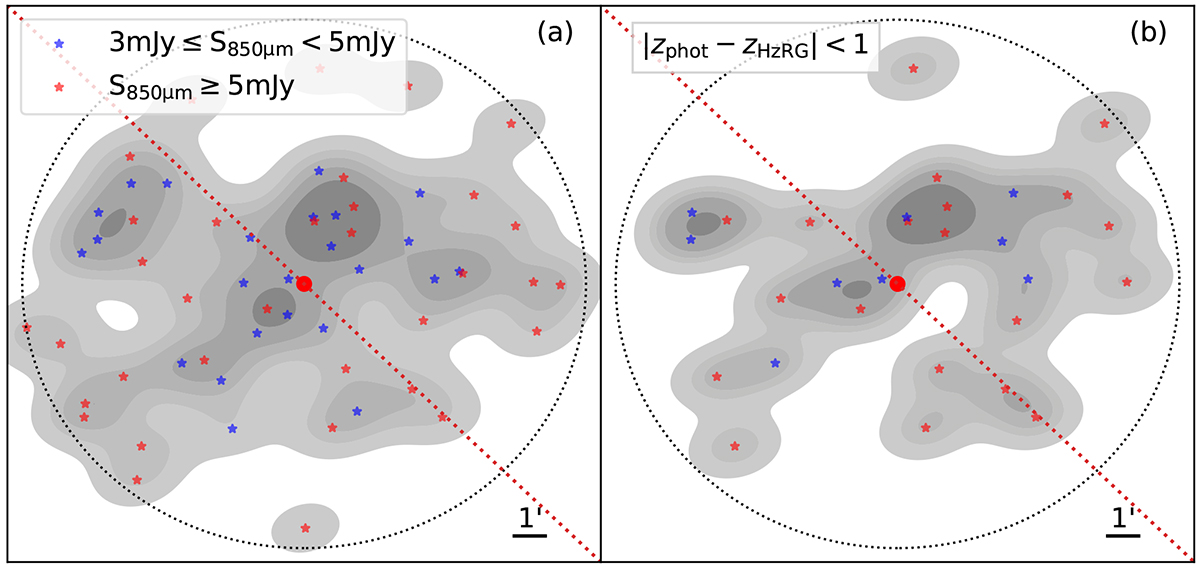
Fig. 13.
Download original image
Kernel density estimate plots of (a) SCUBA-2 850 μm and (b) 850 μm sources with photo-z close to 4C 23.56 (Δz < 1), with 10% as the contour step. The direction of the radio jet is shown as dotted red lines. The FoV is indicated as a dotted circle. Bright and faint SCUBA-2 sources are color-coded by red and blue, respectively. After the redshift selection, the SMGs still show the angular preference.
Current usage metrics show cumulative count of Article Views (full-text article views including HTML views, PDF and ePub downloads, according to the available data) and Abstracts Views on Vision4Press platform.
Data correspond to usage on the plateform after 2015. The current usage metrics is available 48-96 hours after online publication and is updated daily on week days.
Initial download of the metrics may take a while.