Fig. 12.
Download original image
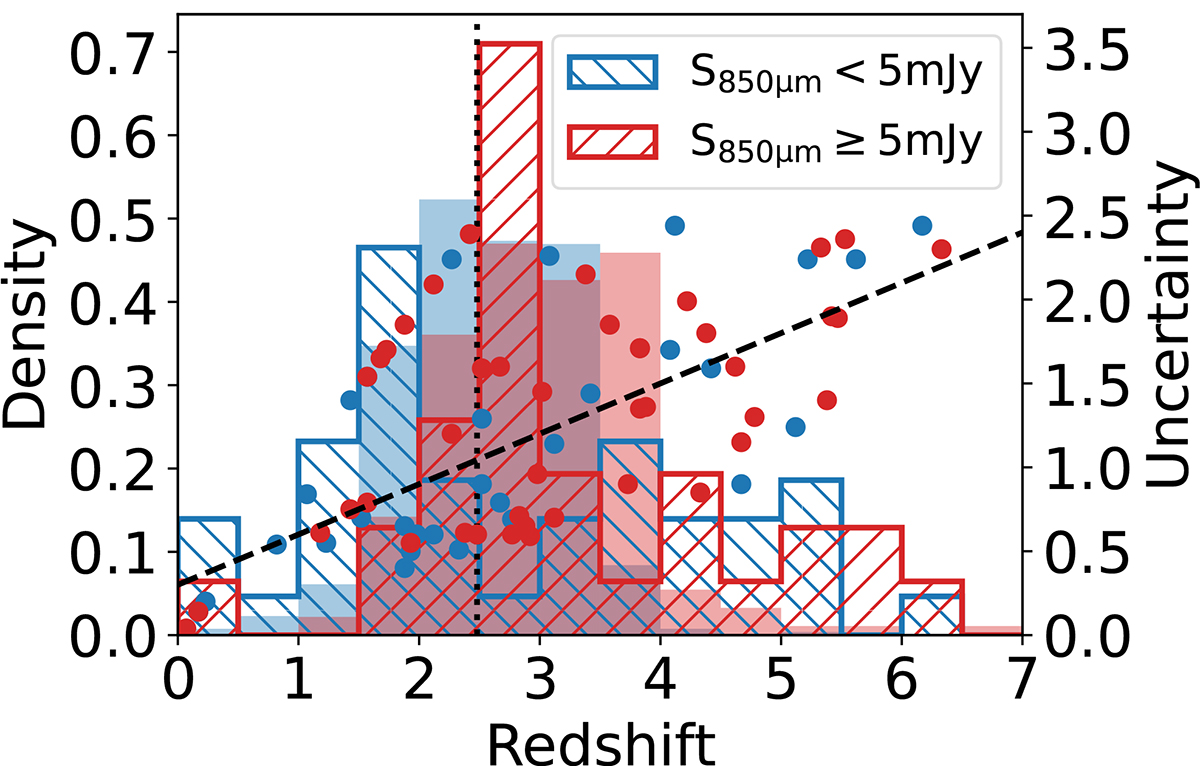
Photo-z density distribution of the 80 SMGs detected above 3.5σ in the 850 μm map (hatched) and the corresponding SMG redshift distribution of the blank field from Dudzevičiūtė et al. (2020) as the background. The dotted line represents the redshift of 4C 23.56. We divide the sample into bright (Sobs ≥ 5 mJy) and faint (Sobs < 5 mJy) SMGs. The photo-z uncertainties are indicated as scatters with corresponding colors and its relation with the redshift (Δz ≈ 0.3(1 + z)) is shown by the dashed line. Compared to the redshift distribution of field SMGs, bright SMGs show a higher density at the redshift of the HzRG, while faint sources are concentrated on a lower redshift.
Current usage metrics show cumulative count of Article Views (full-text article views including HTML views, PDF and ePub downloads, according to the available data) and Abstracts Views on Vision4Press platform.
Data correspond to usage on the plateform after 2015. The current usage metrics is available 48-96 hours after online publication and is updated daily on week days.
Initial download of the metrics may take a while.